Find Schools

Study Area & Zipcode

Cuyahoga Community College District

Find Schools Near

Cuyahoga Community College District Overview

Cuyahoga Community College District is a public institution situated in Cleveland, Ohio. The location of the school is great for students who enjoy the amenities of city life.

What Is Cuyahoga Community College District Known For?

4,176 Undergraduate Awards
  • Although it may not be available for every major, the associate's degree is the highest award a student can attain at Cuyahoga Community College District.
  • In 2017-2018, 28% of the faculty were full-time.

Best Schools

Cuyahoga Community College District Rankings

Our rankings are based on an outcomes-based approach rather than subjective ones used by other media outlets. As such, we utilize data from the Integrated Postsecondary Education Data System (IPEDS) and the College Scorecard, among other sources. Visit our rankings and methodology section to learn more.

Program Level Awards

These are highlights of some of the most noteworthy awards granted to specific programs at Cuyahoga Community College District.

Rank Ranking Name Share
#2 Best Computer Engineering Undergraduate Certificate Schools Tweet It - Post It
#7 Best Computer Programming Undergraduate Certificate Schools Tweet It - Post It
#7 Best Hospitality Management Undergraduate Certificate Schools Tweet It - Post It
#13 Best Accounting Undergraduate Certificate Schools Tweet It - Post It
#13 Best Entrepreneurial Studies Associate Degree Schools Tweet It - Post It
#23 Best Business Support & Assistance Undergraduate Certificate Schools Tweet It - Post It
#35 Best Business, Management & Marketing Undergraduate Certificate Schools Tweet It - Post It
#100 Best Liberal Arts & Humanities Associate Degree Schools Tweet It - Post It
#100 Best Liberal Arts General Studies Associate Degree Schools Tweet It - Post It
#104 Best Value Personal & Culinary Services Undergraduate Certificate Schools Tweet It - Post It

Awards From Around the Web

The following table lists some notable awards Cuyahoga Community College District has earned from around the web.

Rank Ranking Name Source
#6 Best Somatic Bodywork & Therapeutic Services Schools College Factual
#6 Best Massage Therapy/Therapeutic Massage Schools College Factual
#25 Best Computer Programming Schools College Factual
#38 Best Business Undergraduate Certificate Schools Business Degree Central
#144 Best Liberal Arts / Sciences & Humanities Schools College Factual
#144 Best Liberal Arts General Studies Schools College Factual

Where Is Cuyahoga Community College District?

undefined

Contact details for Cuyahoga Community College District are given below.

Contact Details
Address: 700 Carnegie Ave, Cleveland, OH 44115-2878
Phone: 800-954-8742

Since Cuyahoga Community College District has an open admissions policy, you should not have any trouble getting into the school as long as you have a high school diploma or the equivalent.

Can I Afford Cuyahoga Community College District?

30% Take Out Loans
15.2% Loan Default Rate

Student Loan Debt

While almost two-thirds of students nationwide take out loans to pay for college, the percentage may be quite different for the school you plan on attending. At Cuyahoga Community College District, approximately 30% of students took out student loans averaging $1,887 a year. That adds up to $7,548 over four years for those students.

The student loan default rate at Cuyahoga Community College District is 15.2%. Watch out! This is significantly higher than the national default rate of 10.1%, which means you could have trouble paying back your student loans if you take any out.

Cuyahoga Community College District Undergraduate Student Diversity

5,014 Full-Time Undergraduates
58% Women
38% Racial-Ethnic Minorities*
There are 18,754 undergraduate students at Cuyahoga Community College District, with 5,014 being full-time and 13,740 being part-time.

undefined

Gender Diversity

Of the 5,014 full-time undergraduates at Cuyahoga Community College District, 42% are male and 58% are female.

undefined

Racial-Ethnic Diversity

The racial-ethnic breakdown of Cuyahoga Community College District students is as follows.

undefined
Race/Ethnicity Number of Grads
Asian 136
Black or African American 1,069
Hispanic or Latino 409
White 2,651
International Students 231
Other Races/Ethnicities 518

Over 75 countries are represented at Cuyahoga Community College District. The most popular countries sending students to the school are India, Saudi Arabia, and Nigeria.

Online Learning at Cuyahoga Community College District

14,004 Took All Classes Online
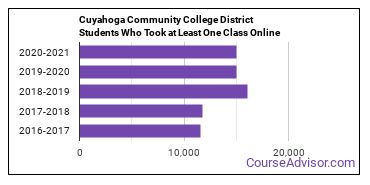
15,060 Took At Least One Class Online
47.8% Avg Growth Over 4 Years
In 2019-2020, 15,060 students took at least one online class at the school.

The following chart shows how the online learning population at Cuyahoga Community College District has changed over the last few years.
undefined

This school is the 5th most popular in Ohio for online learning according to the online graduations recorded by the Department of Education for the academic year 2019-2020.

Online Growth Rankings of Cuyahoga Community College District

The average growth rate over the last four years of online students at Cuyahoga Community College District was 47.8%. This is the #594 largest growth rate of all schools that are mostly online. This refers to all students at Cuyahoga Community College District regardless of major.

The following table shows the 1-year growth rate of Cuyahoga Community College District majors that offer at least one online course. This table only includes majors with positive growth.

Major 1-Year Growth Rate
Accounting 5%
Business, Management & Marketing 4%
Computer & Information Sciences 24%
Computer Programming 16%
Human Resource Management 15%
Information Science 18%
Legal Professions 5%
Legal Support Services 5%
Marketing 41%

The table below shows how the average growth rate over 4 years at Cuyahoga Community College District ranks compared to all other mostly online schools that offer a specific major. Note that the majors may or may not be offered online at Cuyahoga Community College District.

Major Growth Rate Rank
International Business #16
Information Science #30
Legal Support Services #48
Marketing #64
Computer Programming #79
Legal Professions #84
Human Resource Management #95
Entrepreneurial Studies #95
Business Support & Assistant Services #123
Accounting #246
Computer & Information Sciences #317
Liberal Arts / Sciences & Humanities #330
Liberal Arts General Studies #330
Business Administration & Management #490

When we speak of partially online, we are referring to schools whose online population is less than 50% of its total student body. Mostly online refers to those with online populations greater than or equal to 50%.

Cuyahoga Community College District Undergraduate Concentrations

The table below shows the number of awards for each concentration.

Major Basic Certificate Associate’s Undergraduate Certificate TOTAL
Liberal Arts General Studies 0 1,804 0 1,804
Allied Health Professions 105 139 63 307
Nursing 0 255 0 255
Accounting 0 54 111 165
Computer Engineering Technology 32 34 65 131
Information Science 49 45 0 94
Vehicle Maintenance & Repair 41 25 24 90
Culinary Arts 9 23 54 86
Health & Medical Administrative Services 40 18 17 75
Design & Applied Arts 16 52 7 75
Allied Health & Medical Assisting Services 0 43 30 73
Somatic Bodywork & Therapeutic Services 18 6 46 70
Business Administration & Management 0 65 1 66
Legal Support Services 13 21 25 59
Criminal Justice & Corrections 0 45 11 56
Computer Programming 0 38 13 51
Ground Transportation 0 0 51 51
Industrial Production Technology 37 2 3 42
Hospitality Management 11 16 14 41
Precision Metal Working 22 2 17 41
Practical Nursing & Nursing Assistants 0 0 38 38
Business Support & Assistant Services 7 5 17 29
Entrepreneurial Studies 0 28 0 28
Human Resource Management 0 26 0 26
Teacher Education Grade Specific 0 24 0 24
Engineering Technology (Other) 0 24 0 24
Clinical/Medical Laboratory Science 23 0 1 24
Mental & Social Health Services 13 10 0 23
Film, Video & Photographic Arts 13 10 0 23
Horticulture 7 12 3 22
Mechanical Engineering Technology 0 21 0 21
Health & Physical Education 0 20 0 20
Audiovisual Communications 3 12 4 19
Marketing 1 16 0 17
Other Construction 13 1 2 16
Electronics Engineering Technology 0 8 8 16
Dental Support Services 0 16 0 16
Computer Software & Applications 0 9 5 14
Electromechanical Engineering Technology 0 9 4 13
Building Management & Inspection 0 0 12 12
American Sign Language 0 12 0 12
Construction Management 0 0 11 11
Plumbing & Water Supply 0 1 10 11
Educational Administration 11 0 0 11
Information Technology 0 10 0 10
Plant Sciences 9 0 0 9
Ophthalmic & Optometric Support Services 2 3 4 9
Construction Engineering Technology 0 7 0 7
Dietetics & Clinical Nutrition Services 0 4 3 7
Dispute Resolution 7 0 0 7
Teacher Education Subject Specific 0 0 6 6
International Business 0 5 0 5
Landscape Architecture 4 0 0 4
Heavy/Industrial Equipment Maintenance 0 2 2 4
Drafting & Design Engineering Technology 0 0 3 3
Carpentry 0 2 0 2
Public Health 0 1 0 1
TOTAL 506 2,985 685 4,176

References

*The racial-ethnic minorities count is calculated by taking the total number of students and subtracting white students, international students, and students whose race/ethnicity was unknown. This number is then divided by the total number of students at the school to obtain the racial-ethnic minorities percentage.

More about our data sources and methodologies.

Featured Schools

Find Schools Near You

Our free school finder matches students with accredited colleges across the U.S.