Communication & Journalism at Queens College
QC is located in Queens, New York and has a total student population of 19,700.
Want to know more about the career opportunities in this field? Check out the Careers in Communication & Journalism section at the bottom of this page.
QC Communication & Journalism Degrees Available
- Bachelor’s Degree in Communication & Journalism
- Master’s Degree in Communication & Journalism
QC Communication & Journalism Rankings
The communication & journalism major at QC is not ranked on College Factual’s Best Colleges and Universities for Communication & Journalism. This could be for a number of reasons, such as not having enough data on the major or school to make an accurate assessment of its quality.
Find Queens College Programs
With an online bachelor's degree in communication you'll have the opportunity to pursue a multitude of career options. From journalism and social media, to public relations, advertising and mass media, earning your BA in communication will allow you to strategize and communicate your ideas.

Effective communicators are always in demand, no matter the industry. The Master's in Communication degree from Southern New Hampshire University is a cutting-edge program designed for forward-thinking professionals.
BA in Communication - New Media
Explore the digital frontier as it relates to today's communications strategies with this specialized online bachelor's from Southern New Hampshire University.
Communication & Journalism Student Demographics at QC
Take a look at the following statistics related to the make-up of the communication & journalism majors at Queens College.
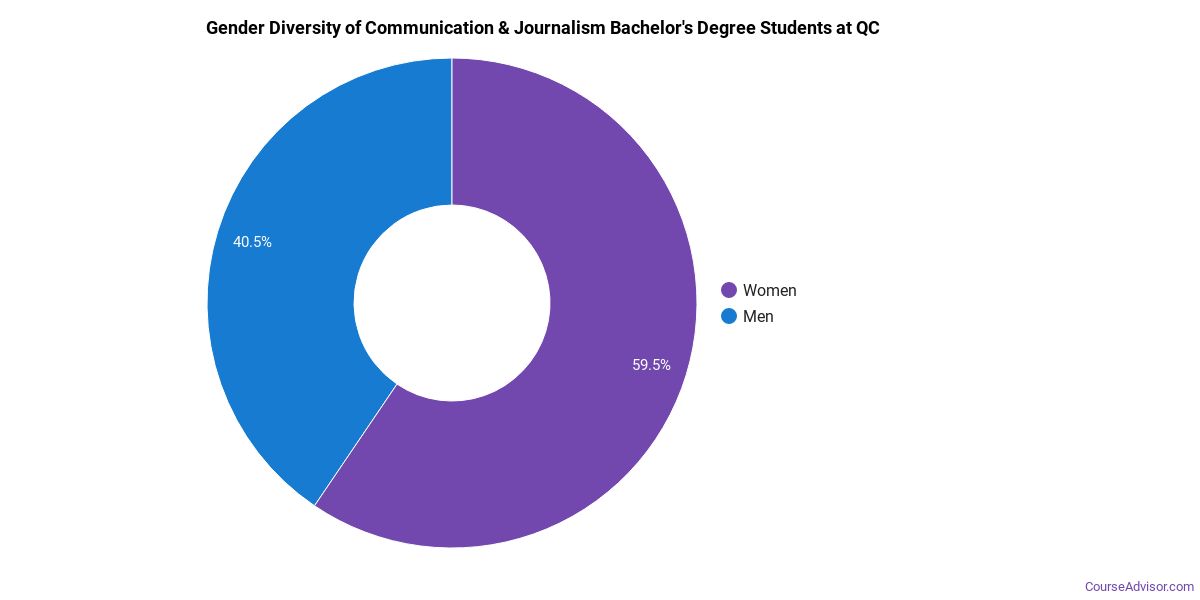
QC Communication & Journalism Bachelor’s Program
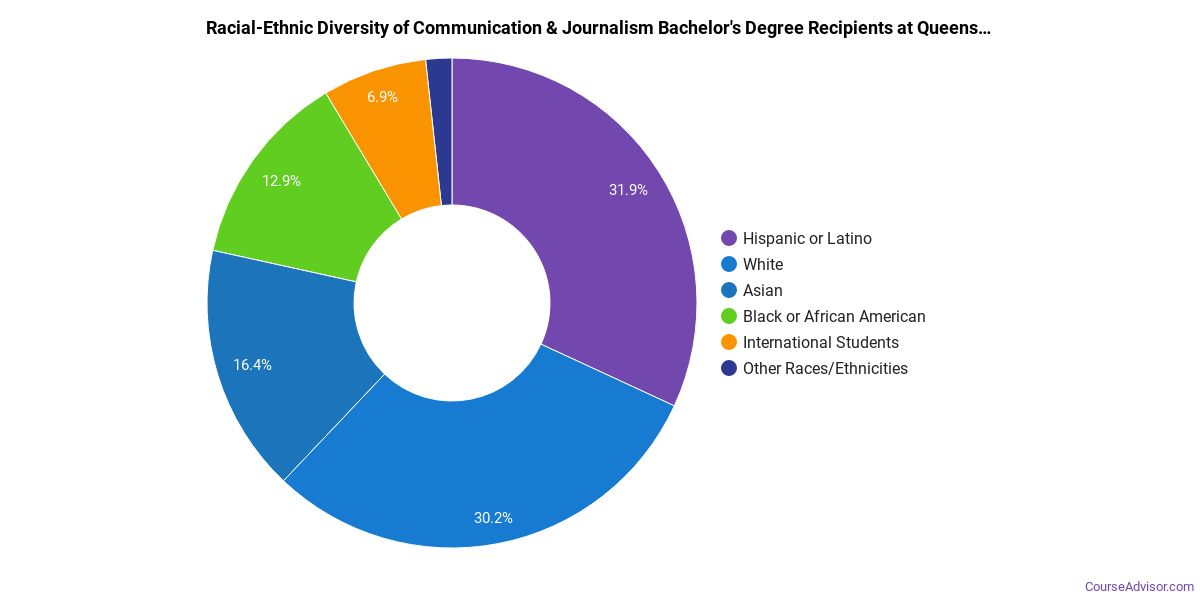
Prospective students may be interested in knowing that this school graduates 27% more racial-ethnic minorities in its communication & journalism bachelor's program than the national average.*
The following table and chart show the race/ethnicity for students who recently graduated from Queens College with a bachelor's in communication & journalism.
| Race/Ethnicity | Number of Students |
|---|---|
| Asian | 16 |
| Black or African American | 9 |
| Hispanic or Latino | 25 |
| White | 26 |
| International Students | 3 |
| Other Races/Ethnicities | 3 |
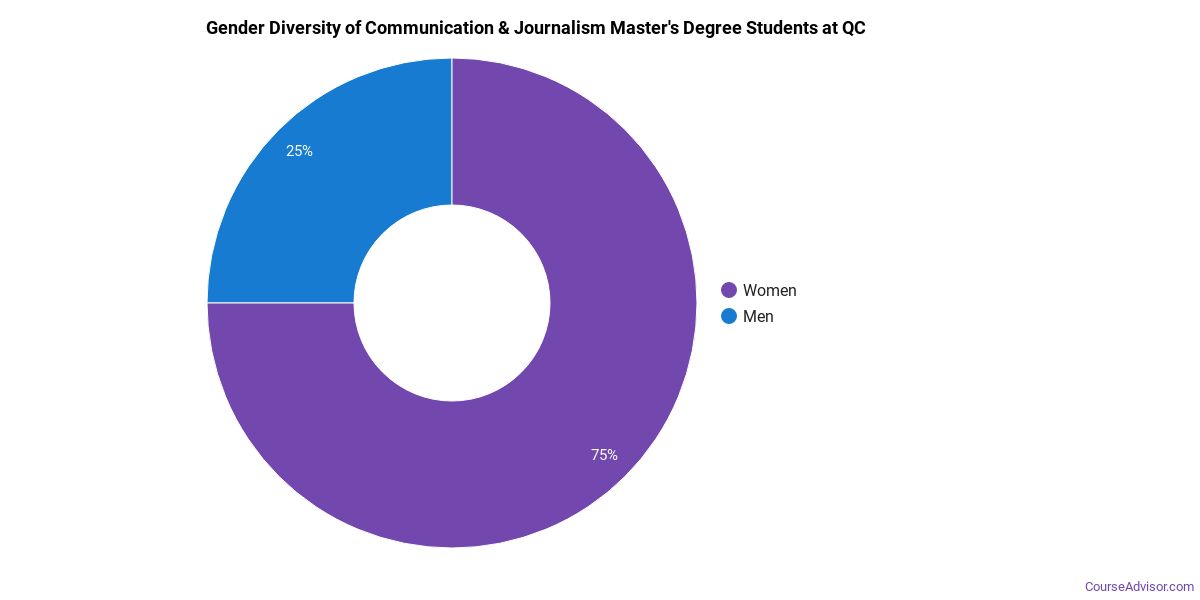
QC Communication & Journalism Master’s Program
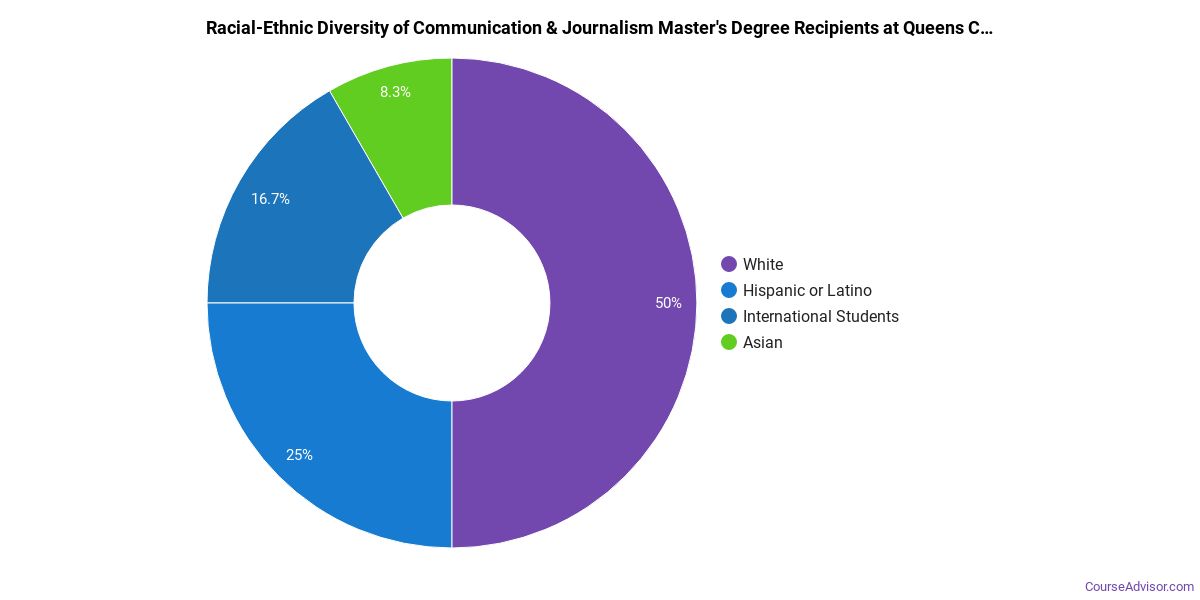
Of the students who received a communication & journalism master's degree from QC, 75% were white. This is above average for this degree on the natiowide level.
The following table and chart show the race/ethnicity for students who recently graduated from Queens College with a master's in communication & journalism.
| Race/Ethnicity | Number of Students |
|---|---|
| Asian | 0 |
| Black or African American | 0 |
| Hispanic or Latino | 1 |
| White | 3 |
| International Students | 0 |
| Other Races/Ethnicities | 0 |
Concentrations Within Communication & Journalism
The following communication & journalism concentations are available at Queens College. The completion numbers here include all graduates who receive any type of degree in this field from Queens College. Some of these focus areas may not be available for your degree level.
| Concentration | Annual Degrees Awarded |
|---|---|
| Communication & Media Studies | 128 |
Related Majors
- Liberal Arts / Sciences & Humanities
- Philosophy & Religious Studies
- Area, Ethnic, Culture, & Gender Studies
- Family, Consumer & Human Sciences
- Foreign Languages & Linguistics
Related Programs
Learn about other programs related to Queens College that might interest you.
BA in Communication - New Media
Explore the digital frontier as it relates to today's communications strategies with this specialized online bachelor's from Southern New Hampshire University.
BA in Communication - Public Relations
Prepare to develop your skills in building mutually beneficial relationships between organizations and their public audiences.
MA in Communication - New Media & Marketing
Keep your skills and knowledge at the forefront of new media technologies with this specialized online master's from Southern New Hampshire University.
Careers That Communication & Journalism Grads May Go Into
A degree in communication & journalism can lead to the following careers. Since job numbers and average salaries can vary by geographic location, we have only included the numbers for NY, the home state for Queens College.
| Occupation | Jobs in NY | Average Salary in NY |
|---|---|---|
| Producers and Directors | 26,110 | $115,610 |
| Public Relations Specialists | 24,510 | $74,000 |
| Editors | 19,140 | $83,070 |
| Managers | 16,600 | $124,160 |
| Writers and Authors | 7,410 | $86,380 |
References
*The racial-ethnic minorities count is calculated by taking the total number of students and subtracting white students, international students, and students whose race/ethnicity was unknown. This number is then divided by the total number of students at the school to obtain the racial-ethnic minorities percentage.
More about our data sources and methodologies.
Course Advisor provides higher-education, college and university, degree, program, career, salary, and other helpful information to students, faculty, institutions, and other internet audiences. Presented information and data are subject to change. Inclusion on this website does not imply or represent a direct relationship with the company, school, or brand. Information, though believed correct at time of publication, may not be correct, and no warranty is provided. Contact the schools to verify any information before relying on it. Financial aid may be available for those who qualify. The displayed options may include sponsored or recommended results, not necessarily based on your preferences.
© Course Advisor – All Rights Reserved.