History at Columbia University in the City of New York
Columbia is located in New York, New York and has a total student population of 30,135. Of the 2,654 students who graduated with a bachelor’s degree from Columbia University in the City of New York in 2021, 133 of them were history majors.
Want to know more about the career opportunities in this field? Check out the Careers in History section at the bottom of this page.
Featured schools near , edit
Columbia History Degrees Available
- Bachelor’s Degree in History
- Master’s Degree in History
- Doctorate Degree in History
Columbia History Rankings
The history major at Columbia is not ranked on College Factual’s Best Colleges and Universities for History. This could be for a number of reasons, such as not having enough data on the major or school to make an accurate assessment of its quality.
In 2021, 53 students received their master’s degree in history from Columbia. This makes it the #9 most popular school for history master’s degree candidates in the country.
There were 18 students who received their doctoral degrees in history, making the school the #1 most popular school in the United States for this category of students.
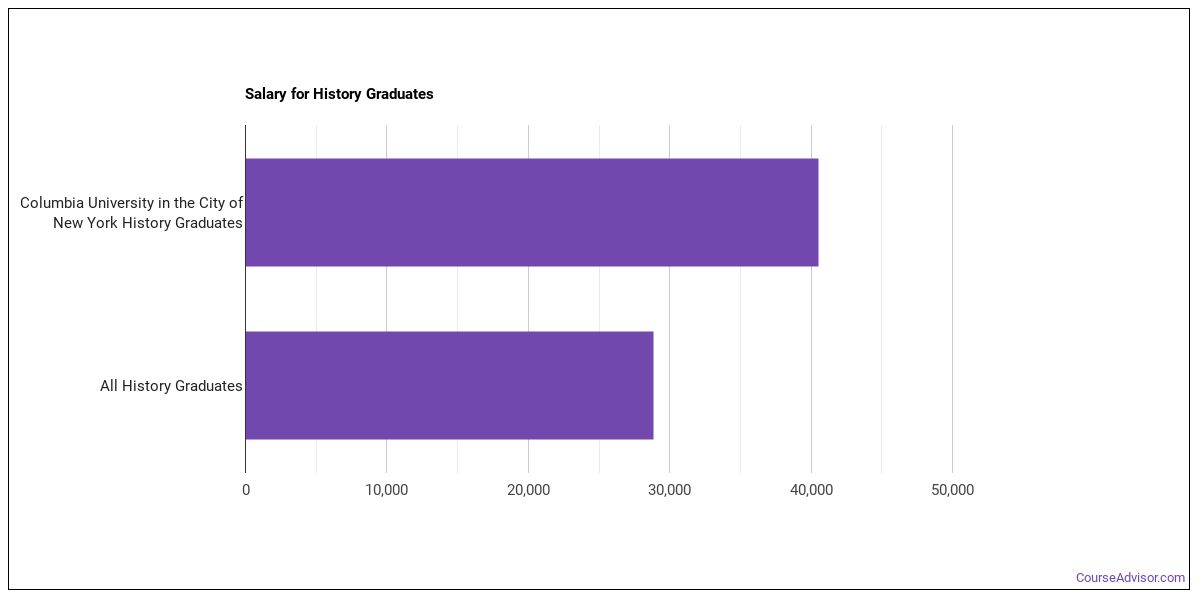
Earnings of Columbia History Graduates
The median salary of history students who receive their bachelor's degree at Columbia is $40,546. This is 40% higher than $28,881, which is the national average for all history bachelor's degree recipients.
History Student Demographics at Columbia
Take a look at the following statistics related to the make-up of the history majors at Columbia University in the City of New York.
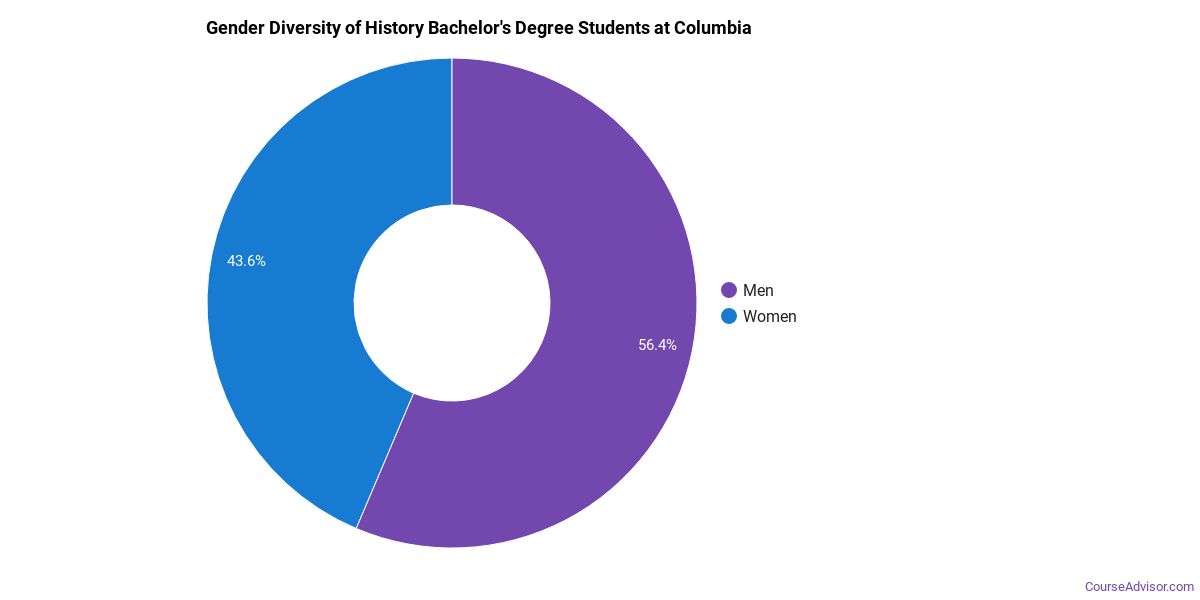
Columbia History Bachelor’s Program
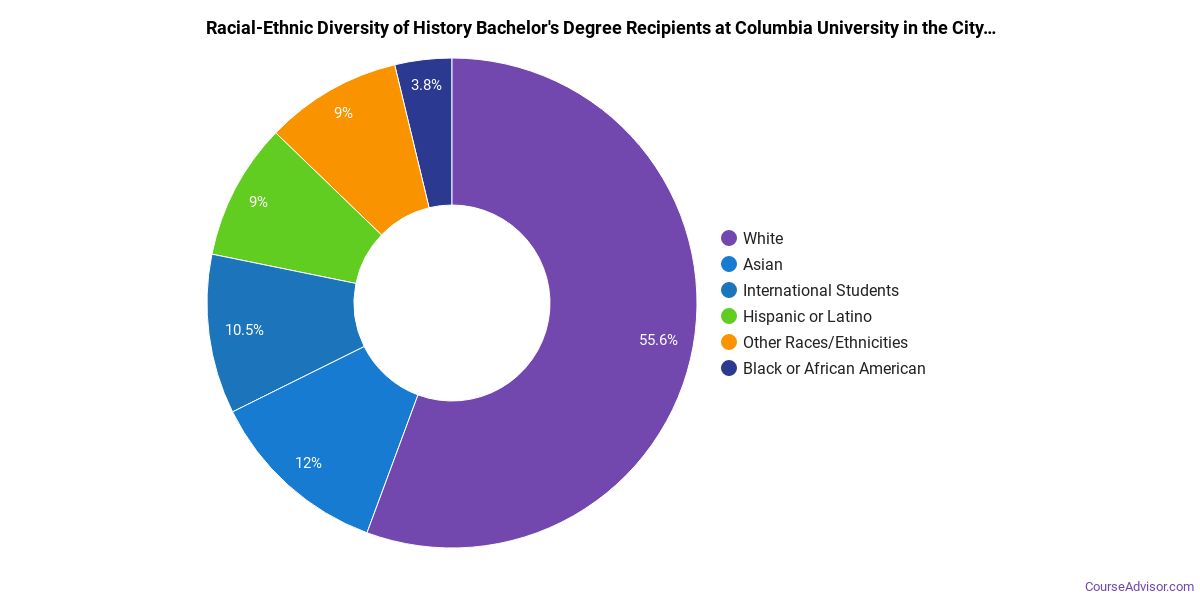
About 56% of those who receive a bachelor's degree in history at Columbia are white. This is below average for this degree on the nationwide level. Prospective students may be interested in knowing that this school graduates 4% more racial-ethnic minorities in its history bachelor's program than the national average.*
The following table and chart show the race/ethnicity for students who recently graduated from Columbia University in the City of New York with a bachelor's in history.
| Race/Ethnicity | Number of Students |
|---|---|
| Asian | 16 |
| Black or African American | 5 |
| Hispanic or Latino | 12 |
| White | 74 |
| International Students | 14 |
| Other Races/Ethnicities | 12 |
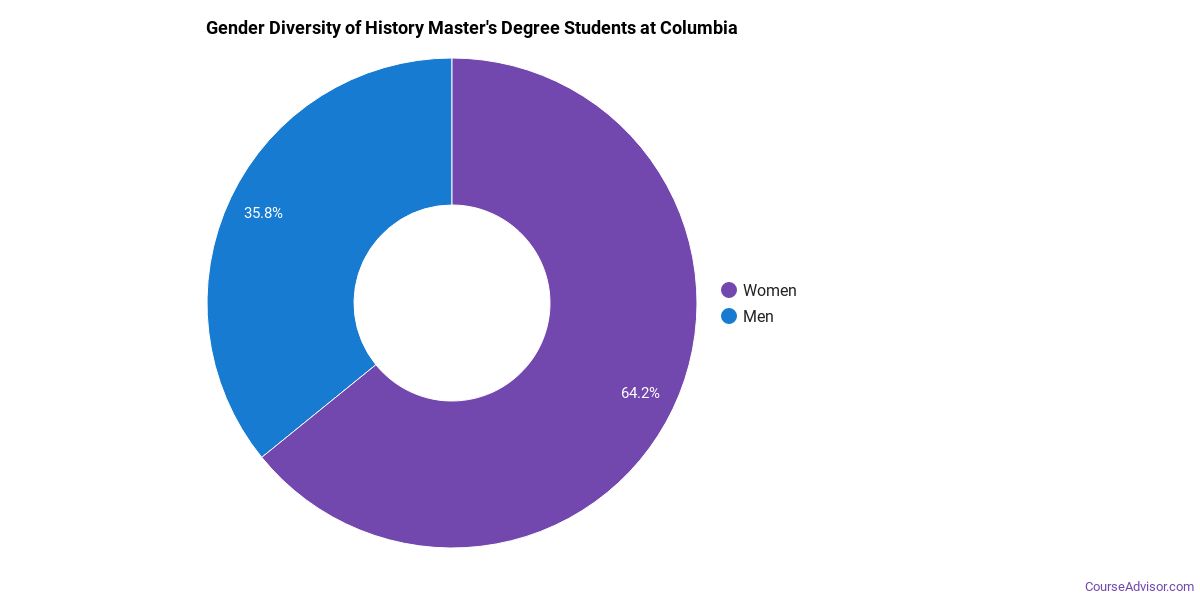
Columbia History Master’s Program
In the history master's program at this school, racial-ethnic minorities make up 32% of degree recipients. That is 4% better than the national average.*
The following table and chart show the race/ethnicity for students who recently graduated from Columbia University in the City of New York with a master's in history.
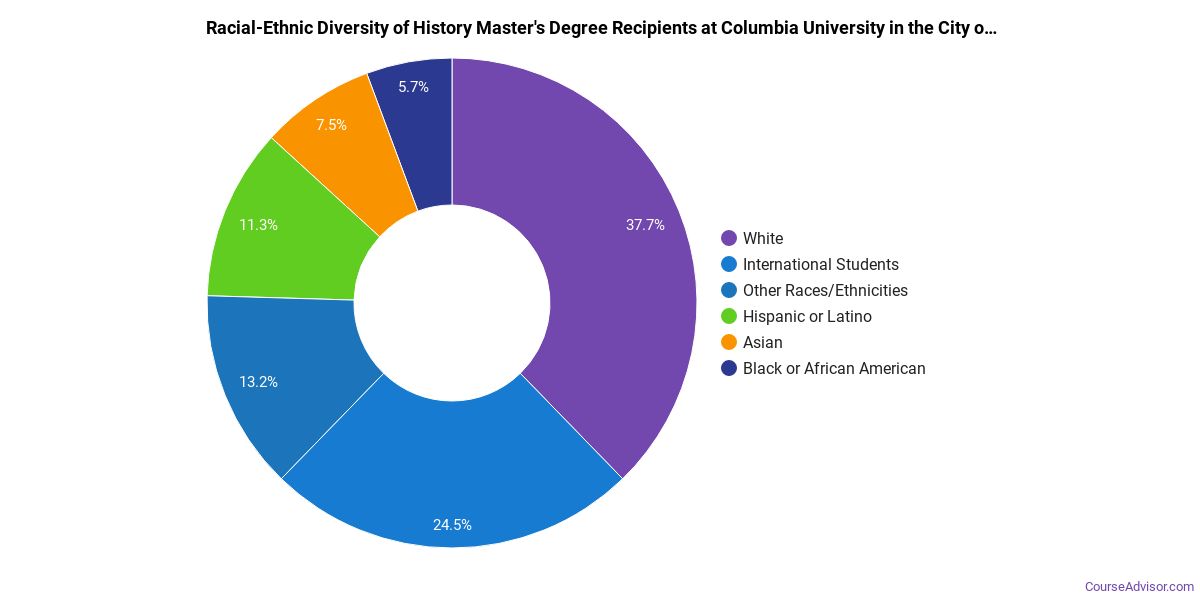
| Race/Ethnicity | Number of Students |
|---|---|
| Asian | 4 |
| Black or African American | 3 |
| Hispanic or Latino | 6 |
| White | 20 |
| International Students | 13 |
| Other Races/Ethnicities | 7 |
Columbia also has a doctoral program available in history. In 2021, 18 students graduated with a doctor's degree in this field.
Careers That History Grads May Go Into
A degree in history can lead to the following careers. Since job numbers and average salaries can vary by geographic location, we have only included the numbers for NY, the home state for Columbia University in the City of New York.
| Occupation | Jobs in NY | Average Salary in NY |
|---|---|---|
| High School Teachers | 74,830 | $85,300 |
| Managers | 16,600 | $124,160 |
| History Professors | 2,050 | $93,000 |
| Curators | 1,570 | $73,850 |
| Museum Technicians and Conservators | 1,490 | $56,040 |
References
*The racial-ethnic minorities count is calculated by taking the total number of students and subtracting white students, international students, and students whose race/ethnicity was unknown. This number is then divided by the total number of students at the school to obtain the racial-ethnic minorities percentage.
- College Factual
- National Center for Education Statistics
- O*NET Online
- Image Credit: By Nandaro under License
More about our data sources and methodologies.
Featured Schools
 Request Info
|
Southern New Hampshire University You have goals. Southern New Hampshire University can help you get there. Whether you need a bachelor's degree to get into a career or want a master's degree to move up in your current career, SNHU has an online program for you. Find your degree from over 200 online programs. Learn More > |
Course Advisor provides higher-education, college and university, degree, program, career, salary, and other helpful information to students, faculty, institutions, and other internet audiences. Presented information and data are subject to change. Inclusion on this website does not imply or represent a direct relationship with the company, school, or brand. Information, though believed correct at time of publication, may not be correct, and no warranty is provided. Contact the schools to verify any information before relying on it. Financial aid may be available for those who qualify. The displayed options may include sponsored or recommended results, not necessarily based on your preferences.
© Course Advisor – All Rights Reserved.