Computer & Information Sciences at Colorado Christian University
CCU is located in Lakewood, Colorado and approximately 7,839 students attend the school each year.
Want to know more about the career opportunities in this field? Check out the Careers in Computer & Information Sciences section at the bottom of this page.
CCU Computer & Information Sciences Degrees Available
- Associate’s Degree in Computer & Information Sciences
- Bachelor’s Degree in Computer & Information Sciences
- Master’s Degree in Computer & Information Sciences
Online Classes Are Available at CCU
Don't have the time or the flexibility in your schedule to take traditional classes? Online courses may be the perfect solution for you. They allow independent learners to study when and where they want to while offering the rigor of in-person classes.
CCU does offer online education options in computer & information sciences for the following degree levels for those interested in distance learning:
- Associate’s Degree
- Bachelor’s Degree
- Master’s Degree
CCU Computer & Information Sciences Rankings
The computer & information sciences major at CCU is not ranked on College Factual’s Best Colleges and Universities for Computer & Information Sciences. This could be for a number of reasons, such as not having enough data on the major or school to make an accurate assessment of its quality.
Computer & Information Sciences Student Demographics at CCU
Take a look at the following statistics related to the make-up of the computer & information sciences majors at Colorado Christian University.
CCU Computer & Information Sciences Associate’s Program
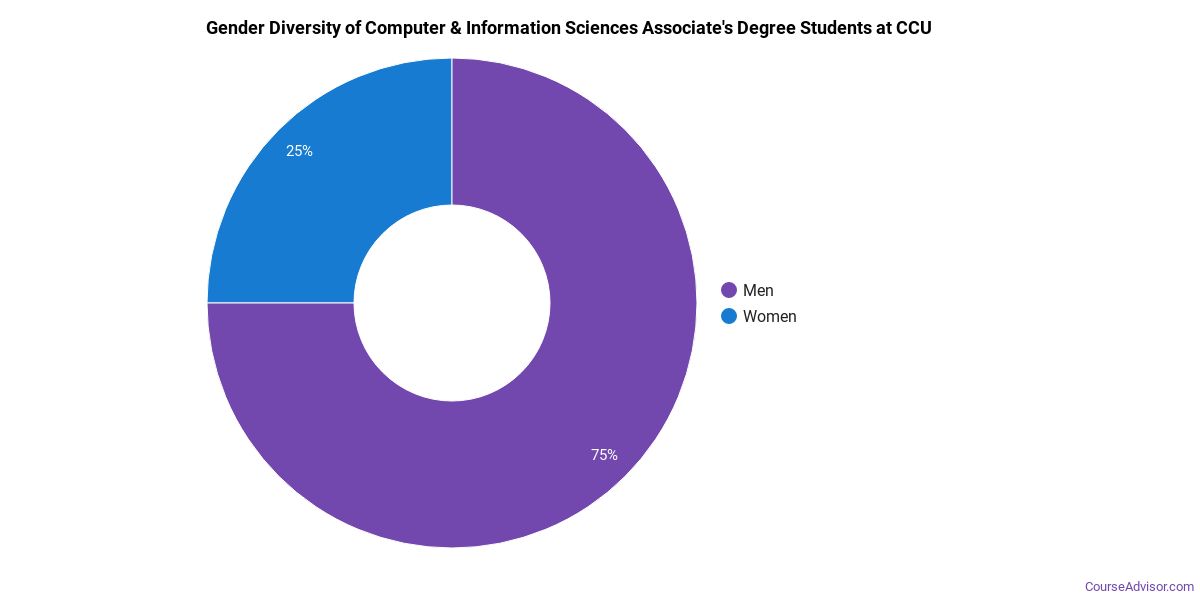
The following table and chart show the race/ethnicity for students who recently graduated from Colorado Christian University with a associate's in computer & information sciences.
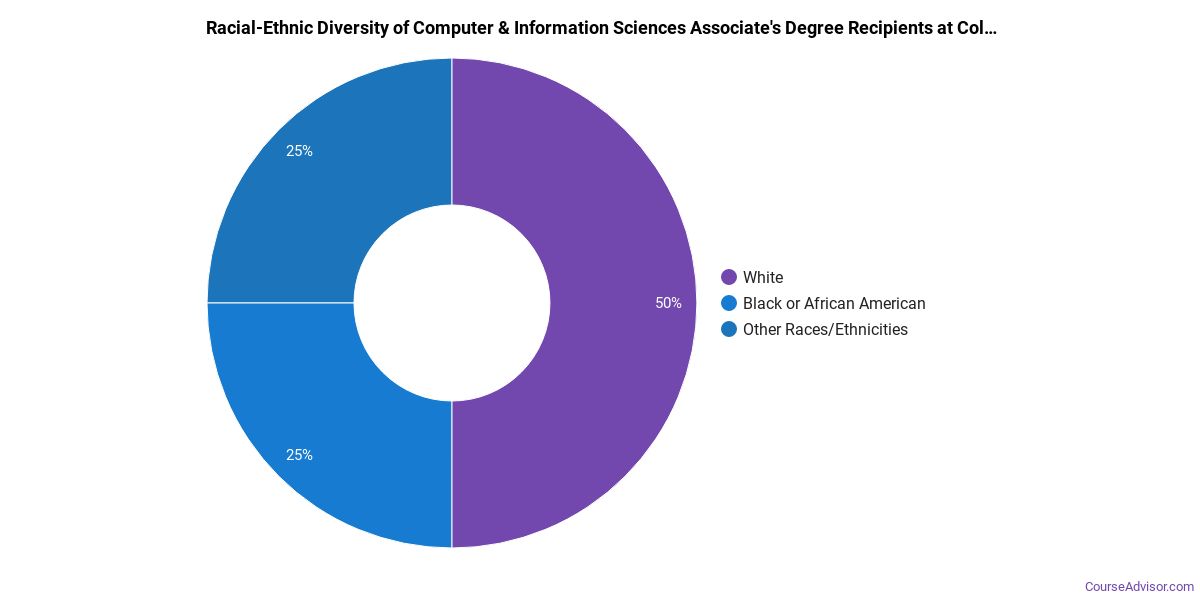
| Race/Ethnicity | Number of Students |
|---|---|
| Asian | 0 |
| Black or African American | 1 |
| Hispanic or Latino | 0 |
| White | 0 |
| International Students | 0 |
| Other Races/Ethnicities | 2 |
CCU Computer & Information Sciences Bachelor’s Program
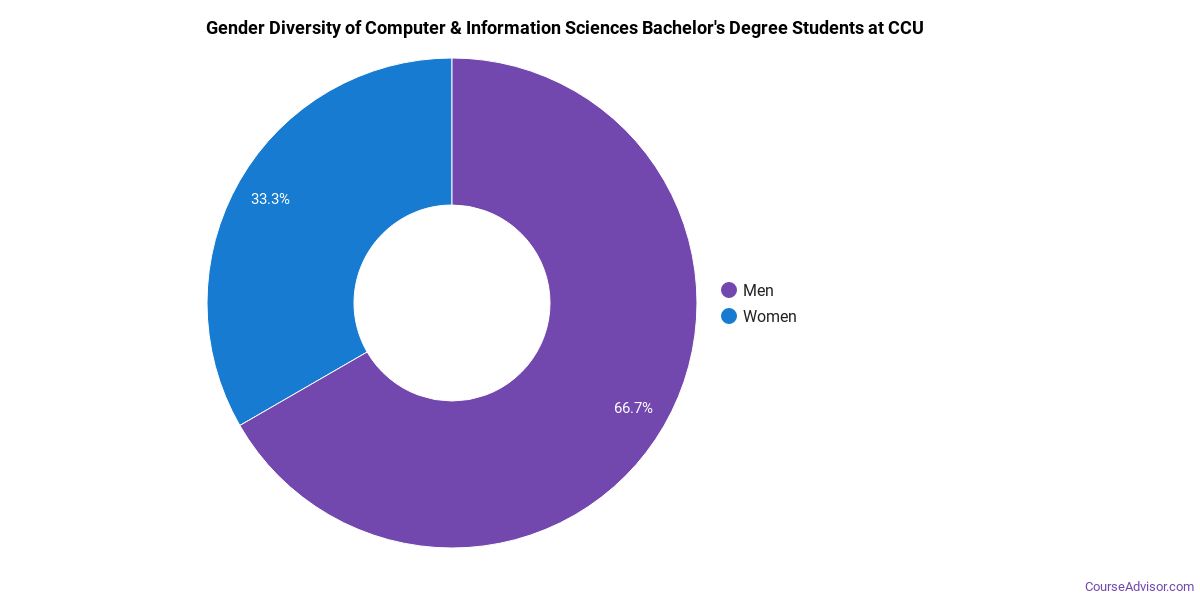
About 70% of those who receive a bachelor's degree in computer & information sciences at CCU are white. This is above average for this degree on the nationwide level.
The following table and chart show the race/ethnicity for students who recently graduated from Colorado Christian University with a bachelor's in computer & information sciences.
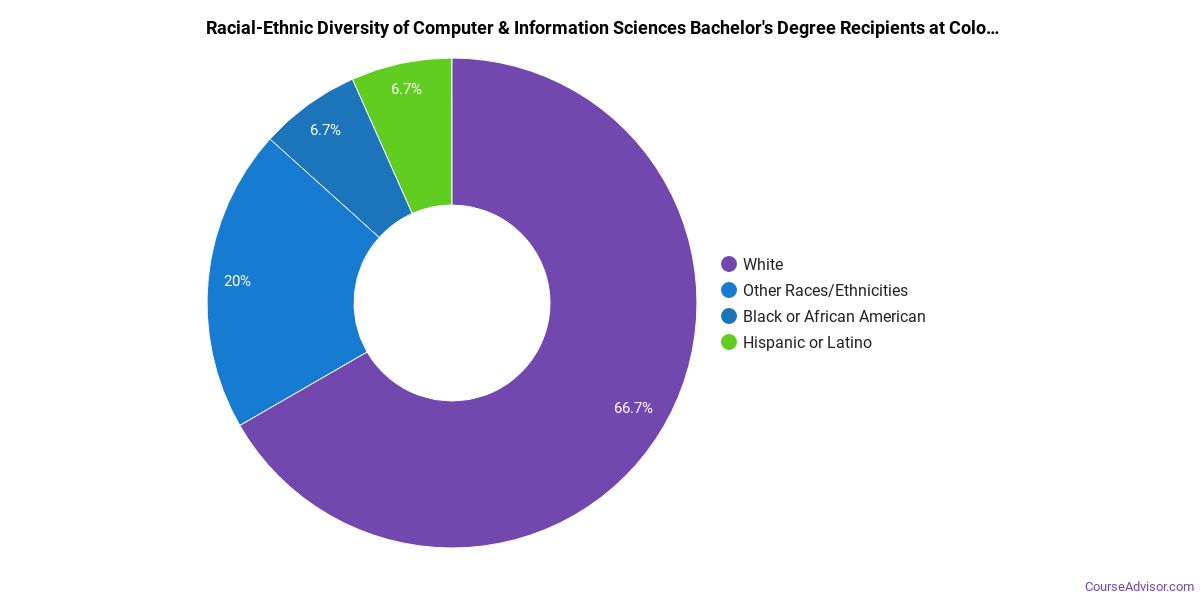
| Race/Ethnicity | Number of Students |
|---|---|
| Asian | 0 |
| Black or African American | 0 |
| Hispanic or Latino | 1 |
| White | 7 |
| International Students | 0 |
| Other Races/Ethnicities | 2 |
CCU Computer & Information Sciences Master’s Program
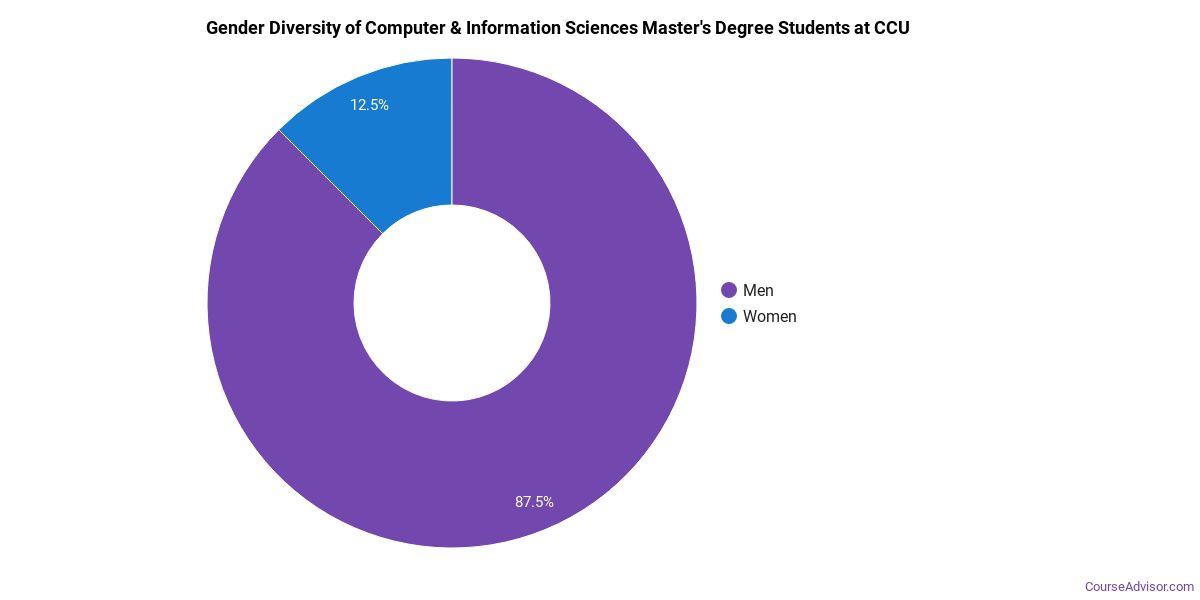
Of the students who received a computer & information sciences master's degree from CCU, 100% were white. This is above average for this degree on the natiowide level.
The following table and chart show the race/ethnicity for students who recently graduated from Colorado Christian University with a master's in computer & information sciences.
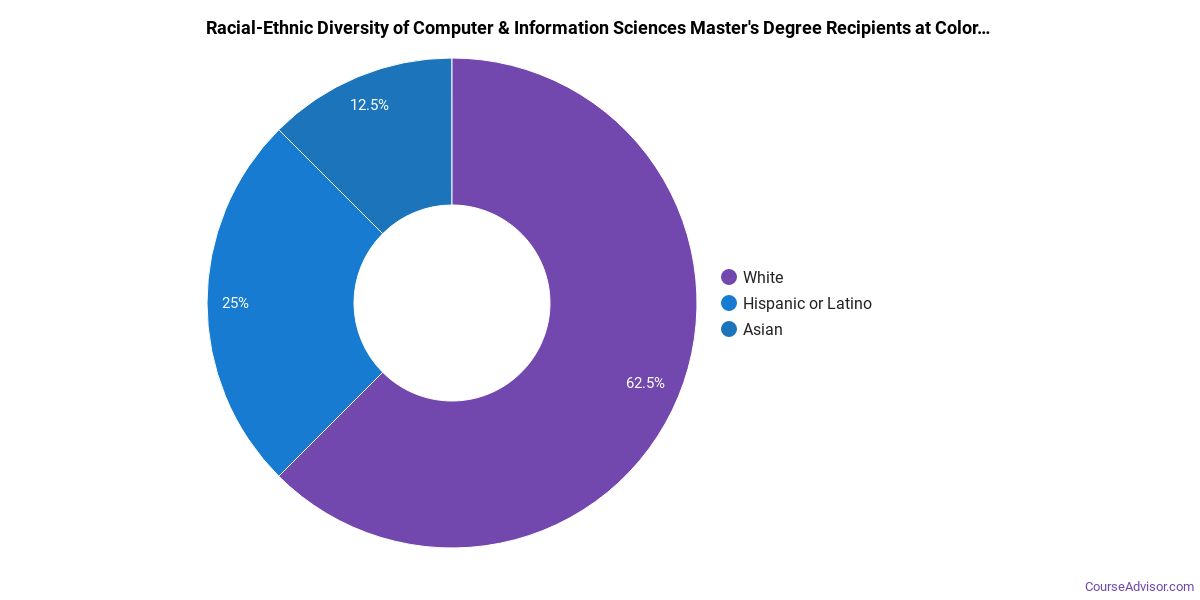
| Race/Ethnicity | Number of Students |
|---|---|
| Asian | 0 |
| Black or African American | 0 |
| Hispanic or Latino | 0 |
| White | 3 |
| International Students | 0 |
| Other Races/Ethnicities | 0 |
Concentrations Within Computer & Information Sciences
If you plan to be a computer & information sciences major, you may want to focus your studies on one of the following concentrations. The table shows all degrees awarded in this field awarded for all degree levels at Colorado Christian University. A concentration may not be available for your level.
| Concentration | Annual Degrees Awarded |
|---|---|
| Computer Information Systems | 19 |
| Information Technology | 9 |
Related Majors
Careers That Computer & Information Sciences Grads May Go Into
A degree in computer & information sciences can lead to the following careers. Since job numbers and average salaries can vary by geographic location, we have only included the numbers for CO, the home state for Colorado Christian University.
| Occupation | Jobs in CO | Average Salary in CO |
|---|---|---|
| Software Applications Developers | 30,400 | $106,730 |
| Computer Workers | 16,440 | $102,470 |
| Computer User Support Specialists | 14,390 | $60,440 |
| Network and Computer Systems Administrators | 11,610 | $84,170 |
| Systems Software Developers | 11,170 | $124,410 |
References
*The racial-ethnic minorities count is calculated by taking the total number of students and subtracting white students, international students, and students whose race/ethnicity was unknown. This number is then divided by the total number of students at the school to obtain the racial-ethnic minorities percentage.
- College Factual
- National Center for Education Statistics
- O*NET Online
- Image Credit: By WebDev1914 under License
More about our data sources and methodologies.
Course Advisor provides higher-education, college and university, degree, program, career, salary, and other helpful information to students, faculty, institutions, and other internet audiences. Presented information and data are subject to change. Inclusion on this website does not imply or represent a direct relationship with the company, school, or brand. Information, though believed correct at time of publication, may not be correct, and no warranty is provided. Contact the schools to verify any information before relying on it. Financial aid may be available for those who qualify. The displayed options may include sponsored or recommended results, not necessarily based on your preferences.
© Course Advisor – All Rights Reserved.