Education at Clarion University of Pennsylvania
Clarion University is located in Clarion, Pennsylvania and has a total student population of 4,465. In 2021, 43 education majors received their bachelor's degree from Clarion University.
Want to know more about the career opportunities in this field? Check out the Careers in Education section at the bottom of this page.
Featured schools near , edit
Clarion University Education Degrees Available
- Basic Certificate in Education (Less Than 1 Year)
- Associate’s Degree in Education
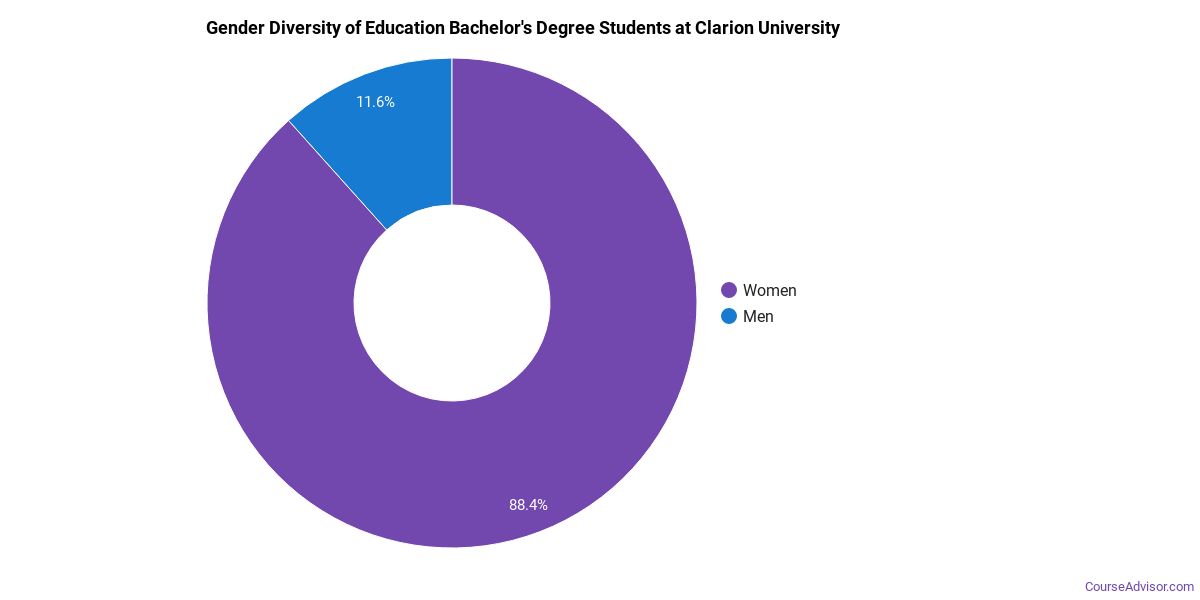
- Bachelor’s Degree in Education
- Master’s Degree in Education
Online Classes Are Available at Clarion University
Don't have the time or the flexibility in your schedule to take traditional classes? Online courses may be the perfect solution for you. They allow independent learners to study when and where they want to while offering the rigor of in-person classes.
Are you one of the many who prefer to take online classes? Clarion University offers distance education options for education at the following degree levels:
- Associate’s Degree
- Master’s Degree
Clarion University Education Rankings
The following rankings from College Factual show how the education progam at Clarion University compares to programs at other colleges and universities.
Note: Although rankings can help you see some information about a school, it's not a good idea to depend on them alone. Be sure to check out other things about the school before making your decision to attend.
Bachelor’s Degree Overall Quality & Other Notable Rankings
The education major at Clarion University is not ranked on College Factual’s Best Colleges and Universities for Education. This could be for a number of reasons, such as not having enough data on the major or school to make an accurate assessment of its quality.
| Ranking Type | Rank |
|---|---|
| Most Popular Online Education Associate Degree Schools | 81 |
| 164 | |
| 279 | |
| Best Education Master’s Degree Schools | 361 |
| Most Popular Education Basic Certificate Schools | 368 |
| 374 | |
| Most Focused Education Basic Certificate Schools | 385 |
| Most Popular Education Schools | 665 |
| Most Focused Education Master’s Degree Schools | 691 |
In 2021, 50 students received their master’s degree in education from Clarion University. This makes it the #616 most popular school for education master’s degree candidates in the country.
Education Student Demographics at Clarion University
Take a look at the following statistics related to the make-up of the education majors at Clarion University of Pennsylvania.
Clarion University Education Associate’s Program
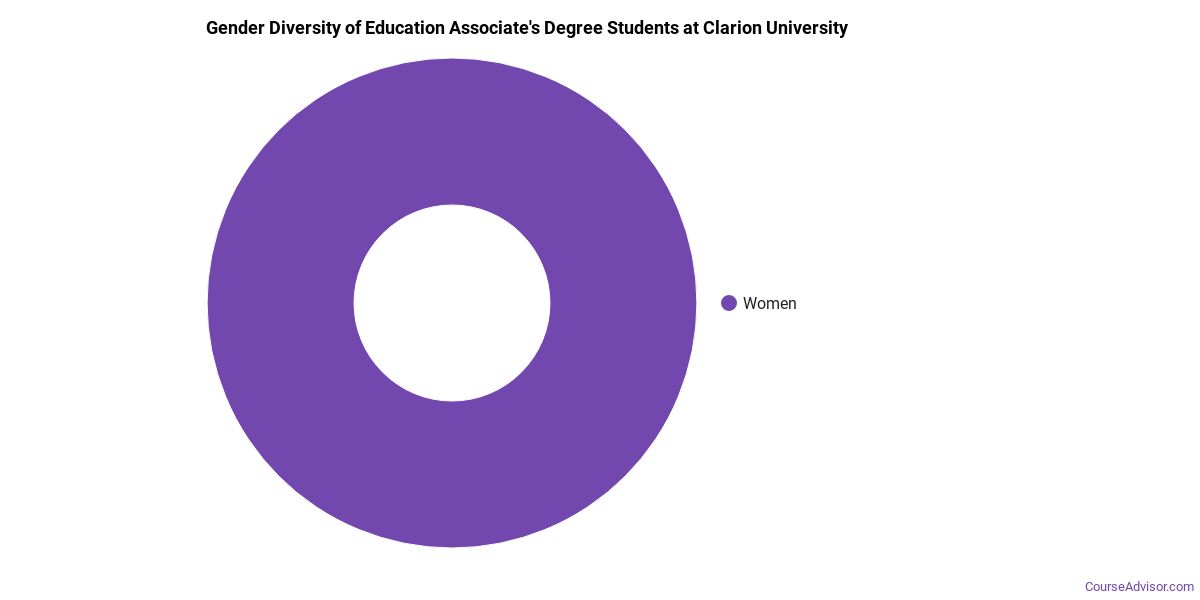
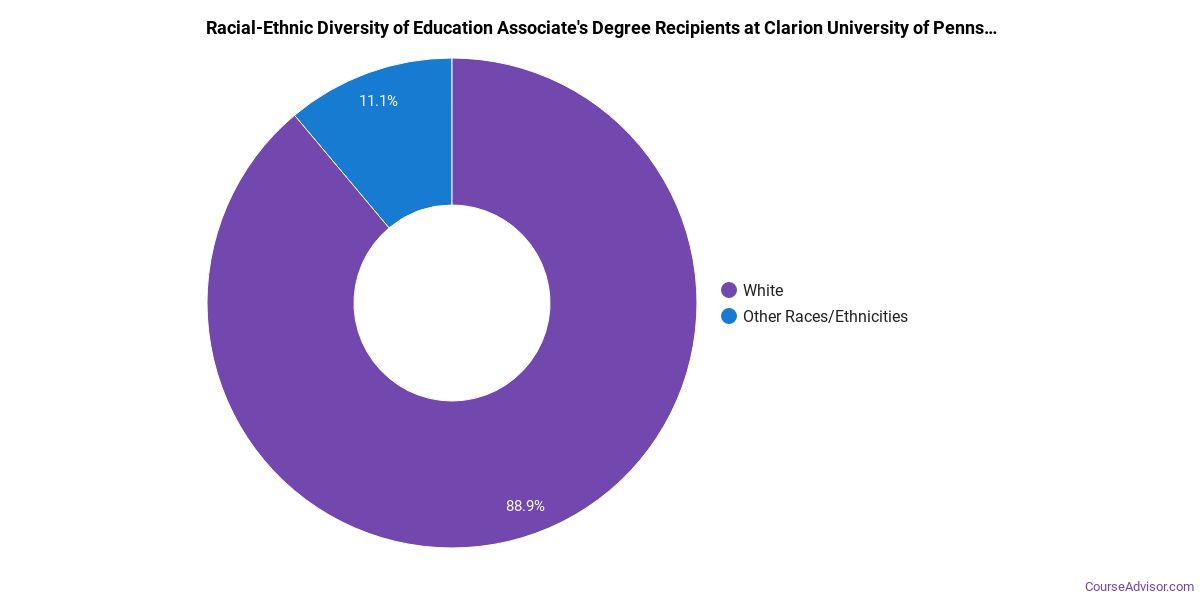
The majority of those who receive an associate's degree in education at Clarion University are white. Around 89% fell into this category, which is below average for this degree.
The following table and chart show the race/ethnicity for students who recently graduated from Clarion University of Pennsylvania with a associate's in education.
| Race/Ethnicity | Number of Students |
|---|---|
| Asian | 0 |
| Black or African American | 0 |
| Hispanic or Latino | 0 |
| White | 8 |
| International Students | 0 |
| Other Races/Ethnicities | 1 |
Clarion University Education Bachelor’s Program
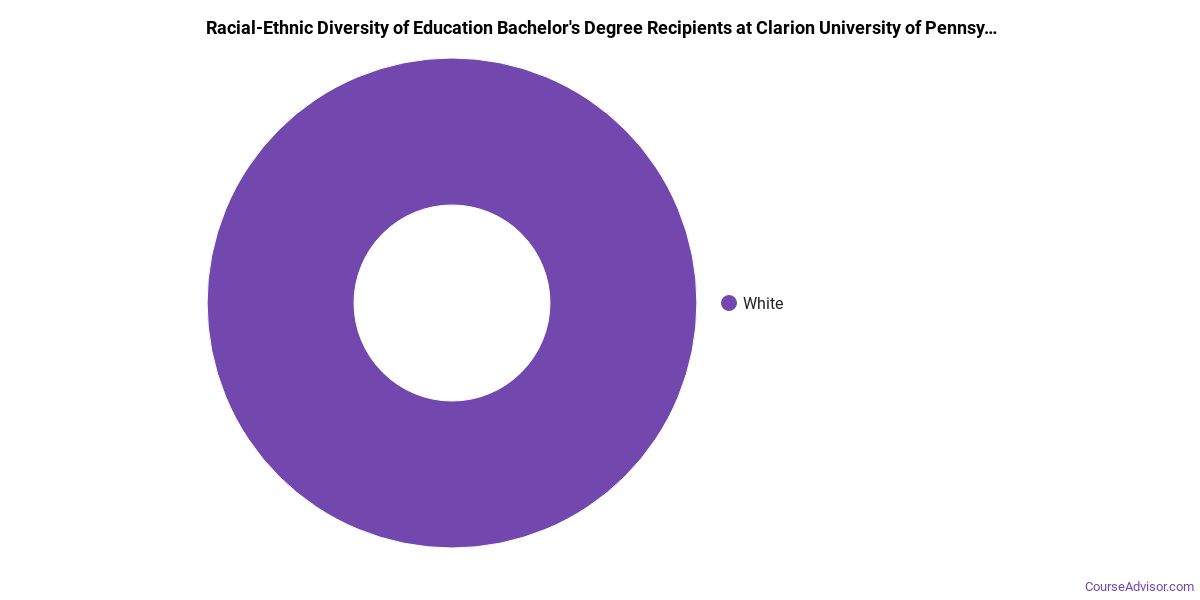
About 100% of those who receive a bachelor's degree in education at Clarion University are white. This is above average for this degree on the nationwide level.
The following table and chart show the race/ethnicity for students who recently graduated from Clarion University of Pennsylvania with a bachelor's in education.
| Race/Ethnicity | Number of Students |
|---|---|
| Asian | 0 |
| Black or African American | 0 |
| Hispanic or Latino | 0 |
| White | 43 |
| International Students | 0 |
| Other Races/Ethnicities | 0 |
Clarion University Education Master’s Program
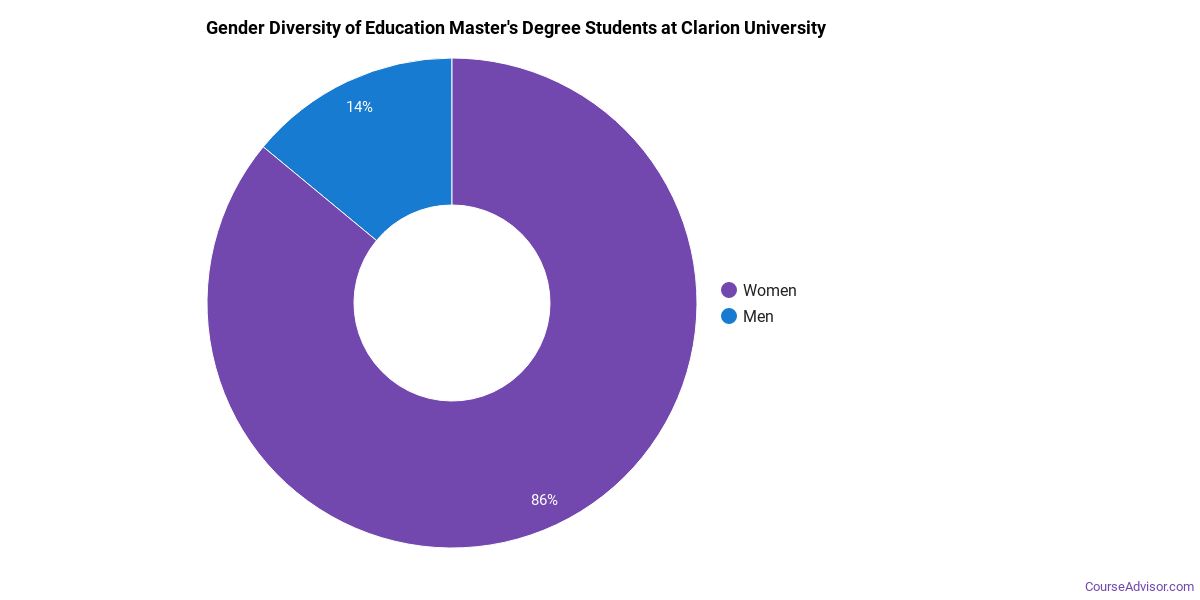
Of the students who received a education master's degree from Clarion University, 94% were white. This is above average for this degree on the natiowide level.
The following table and chart show the race/ethnicity for students who recently graduated from Clarion University of Pennsylvania with a master's in education.
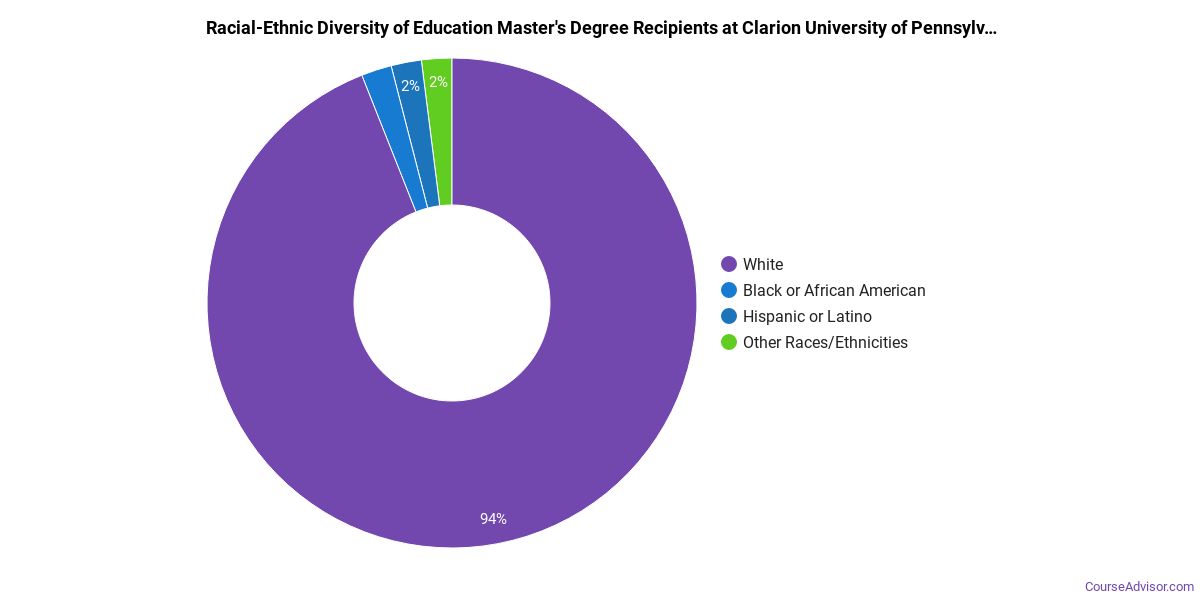
| Race/Ethnicity | Number of Students |
|---|---|
| Asian | 0 |
| Black or African American | 1 |
| Hispanic or Latino | 1 |
| White | 47 |
| International Students | 0 |
| Other Races/Ethnicities | 1 |
Clarion University also has a doctoral program available in education. In 2021, 0 student graduated with a doctor's degree in this field.
Concentrations Within Education
The following education concentations are available at Clarion University of Pennsylvania. The completion numbers here include all graduates who receive any type of degree in this field from Clarion University of Pennsylvania. Some of these focus areas may not be available for your degree level.
| Concentration | Annual Degrees Awarded |
|---|---|
| Teacher Education Grade Specific | 68 |
| Special Education | 37 |
| Other Education | 2 |
Related Majors
Careers That Education Grads May Go Into
A degree in education can lead to the following careers. Since job numbers and average salaries can vary by geographic location, we have only included the numbers for PA, the home state for Clarion University of Pennsylvania.
| Occupation | Jobs in PA | Average Salary in PA |
|---|---|---|
| Elementary School Teachers | 55,200 | $66,860 |
| High School Teachers | 50,460 | $64,830 |
| Teacher Assistants | 46,610 | $26,640 |
| Middle School Teachers | 21,640 | $67,950 |
| Preschool Teachers | 13,480 | $29,250 |
References
*The racial-ethnic minorities count is calculated by taking the total number of students and subtracting white students, international students, and students whose race/ethnicity was unknown. This number is then divided by the total number of students at the school to obtain the racial-ethnic minorities percentage.
- College Factual
- National Center for Education Statistics
- O*NET Online
- Image Credit: By Clarion, Pennsylvania under License
More about our data sources and methodologies.
Featured Schools
 Request Info
|
Southern New Hampshire University You have goals. Southern New Hampshire University can help you get there. Whether you need a bachelor's degree to get into a career or want a master's degree to move up in your current career, SNHU has an online program for you. Find your degree from over 200 online programs. Learn More > |
Course Advisor provides higher-education, college and university, degree, program, career, salary, and other helpful information to students, faculty, institutions, and other internet audiences. Presented information and data are subject to change. Inclusion on this website does not imply or represent a direct relationship with the company, school, or brand. Information, though believed correct at time of publication, may not be correct, and no warranty is provided. Contact the schools to verify any information before relying on it. Financial aid may be available for those who qualify. The displayed options may include sponsored or recommended results, not necessarily based on your preferences.
© Course Advisor – All Rights Reserved.