City Colleges of Chicago - Wilbur Wright College Overview
City Colleges of Chicago - Wilbur Wright College is a public institution located in Chicago, Illinois. Chicago is a great location for students who prefer city over country life.
What Is City Colleges of Chicago - Wilbur Wright College Known For?
- The associate's degree is the highest award offered at Wilbur Wright College.
- In a recent academic period28% of the faculty were full-time.
- Students who graduate from Wilbur Wright College with a bachelor's degree make about $41,625 a year. That's 2% more than those who graduate from other schools.
Where Is City Colleges of Chicago - Wilbur Wright College?
Contact details for Wilbur Wright College are given below.
| Contact Details | |
|---|---|
| Address: | 4300 N Narragansett, Chicago, IL 60634-1500 |
| Phone: | 773-777-7900 |
| Website: | ccc.edu |
How Do I Get Into Wilbur Wright College?
You can apply to Wilbur Wright College online at: apply.ccc.edu/
Can I Afford City Colleges of Chicago - Wilbur Wright College?
Explore Best Ranked Schools for You
City Colleges of Chicago - Wilbur Wright College Undergraduate Student Diversity
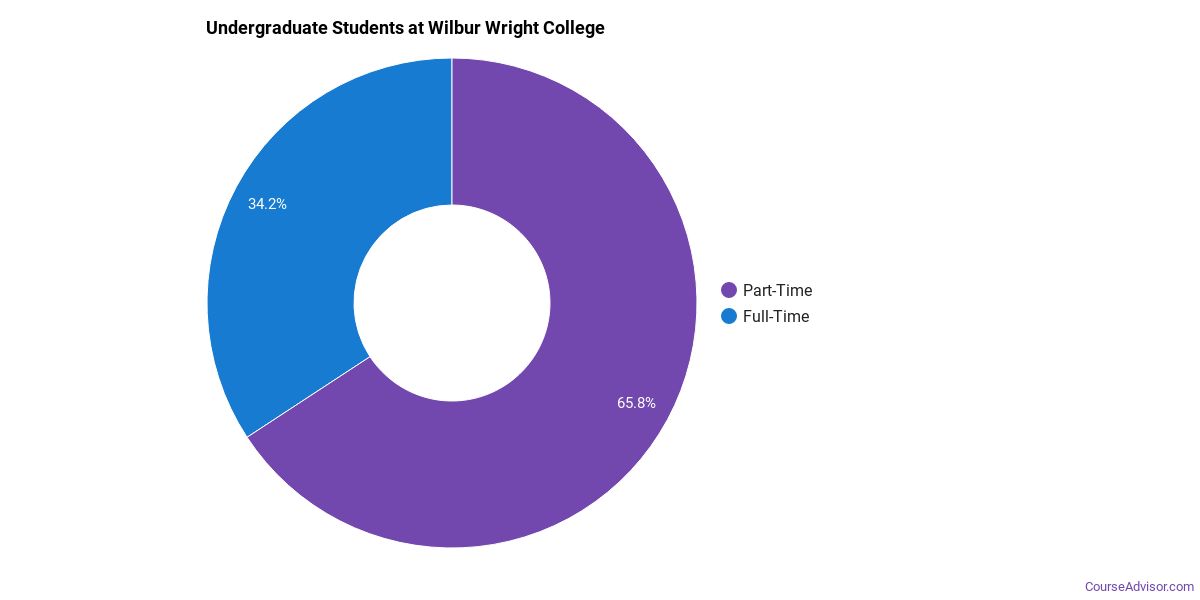
Gender Diversity
Of the 3,113 full-time undergraduates at Wilbur Wright College, 42% are male and 58% are female.

Racial-Ethnic Diversity
The racial-ethnic breakdown of City Colleges of Chicago - Wilbur Wright College students is as follows.

| Race/Ethnicity | Number of Grads |
|---|---|
| Asian | 229 |
| Black or African American | 171 |
| Hispanic or Latino | 1,987 |
| White | 588 |
| International Students | 62 |
| Other Races/Ethnicities | 76 |
Over 68 countries are represented at Wilbur Wright College. The most popular countries sending students to the school are Saudi Arabia, China, and Nigeria.
City Colleges of Chicago - Wilbur Wright College Undergraduate Concentrations
The table below shows the number of awards for each concentration.
| Major | Basic Certificate | Associate’s | Undergraduate Certificate | TOTAL |
|---|---|---|---|---|
| Liberal Arts General Studies | 0 | 496 | 336 | 832 |
| Biological & Physical Science | 0 | 145 | 0 | 145 |
| Precision Metal Working | 48 | 0 | 3 | 51 |
| Information Technology | 25 | 11 | 13 | 49 |
| General Engineering | 0 | 49 | 0 | 49 |
| Legal Support Services | 0 | 33 | 0 | 33 |
| Allied Health & Medical Assisting Services | 0 | 23 | 0 | 23 |
| Computer Systems Networking | 10 | 8 | 0 | 18 |
| Information Science | 18 | 0 | 0 | 18 |
| Criminal Justice & Corrections | 15 | 3 | 0 | 18 |
| Accounting | 10 | 2 | 4 | 16 |
| Computer Programming | 6 | 2 | 1 | 9 |
| Mental & Social Health Services | 6 | 0 | 0 | 6 |
| Fine & Studio Arts | 0 | 6 | 0 | 6 |
| Drafting & Design Engineering Technology | 5 | 0 | 0 | 5 |
| Architectural Sciences & Technology | 0 | 4 | 0 | 4 |
| Library & Archives Assisting | 0 | 2 | 0 | 2 |
| Business Administration & Management | 0 | 0 | 0 | 0 |
| Marketing | 0 | 0 | 0 | 0 |
| Computer Information Systems | 0 | 0 | 0 | 0 |
| Environmental Control Technology | 0 | 0 | 0 | 0 |
| Health & Medical Administrative Services | 0 | 0 | 0 | 0 |
| Social Work | 0 | 0 | 0 | 0 |
| TOTAL | 143 | 784 | 357 | 1,284 |
References
*The racial-ethnic minorities count is calculated by taking the total number of students and subtracting white students, international students, and students whose race/ethnicity was unknown. This number is then divided by the total number of students at the school to obtain the racial-ethnic minorities percentage.
More about our data sources and methodologies.
Course Advisor provides higher-education, college and university, degree, program, career, salary, and other helpful information to students, faculty, institutions, and other internet audiences. Presented information and data are subject to change. Inclusion on this website does not imply or represent a direct relationship with the company, school, or brand. Information, though believed correct at time of publication, may not be correct, and no warranty is provided. Contact the schools to verify any information before relying on it. Financial aid may be available for those who qualify. The displayed options may include sponsored or recommended results, not necessarily based on your preferences.
© Course Advisor – All Rights Reserved.