City Colleges of Chicago - Harry S Truman College Overview
Located in Chicago, Illinois, City Colleges of Chicago - Harry S Truman College is a public institution. The location of the school is great for students who enjoy the amenities of city life.
What Is City Colleges of Chicago - Harry S Truman College Known For?
- Although it may not be available for every major, the associate's degree is the highest award a student can attain at Harry S Truman College.
- In a recent academic period30% of the faculty were full-time.
Where Is City Colleges of Chicago - Harry S Truman College?
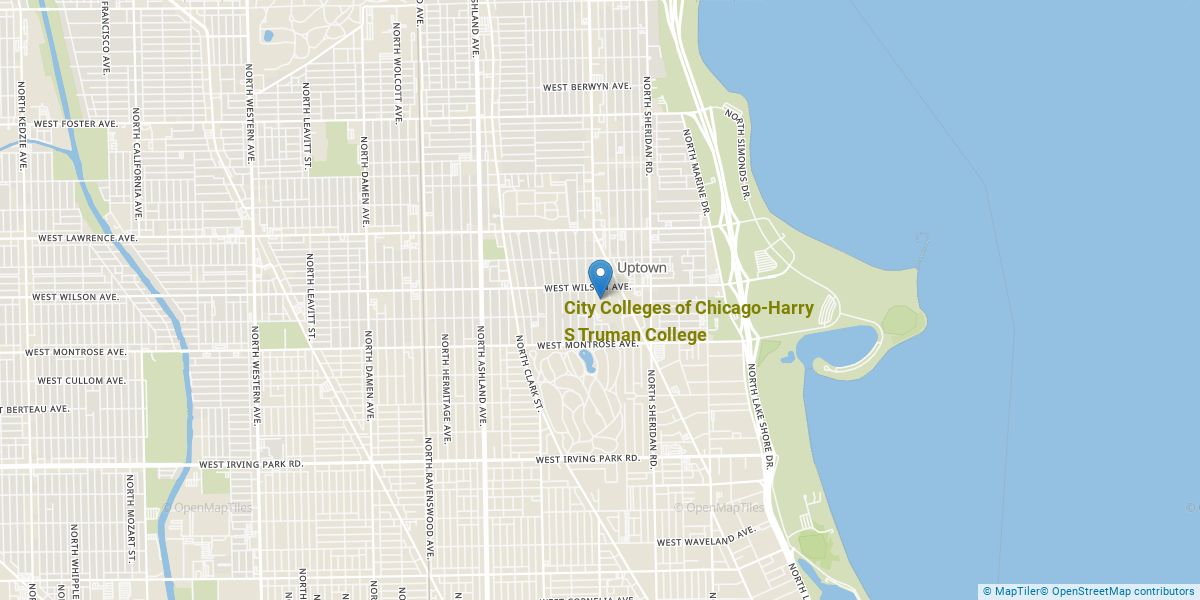
Contact details for Harry S Truman College are given below.
| Contact Details | |
|---|---|
| Address: | 1145 W Wilson Ave., Chicago, IL 60640-6063 |
| Phone: | 773-907-4000 |
| Website: | www.ccc.edu |
How Do I Get Into Harry S Truman College?
You can apply to Harry S Truman College online at: apply.ccc.edu/
Can I Afford City Colleges of Chicago - Harry S Truman College?
Explore Best Ranked Schools for You
City Colleges of Chicago - Harry S Truman College Undergraduate Student Diversity
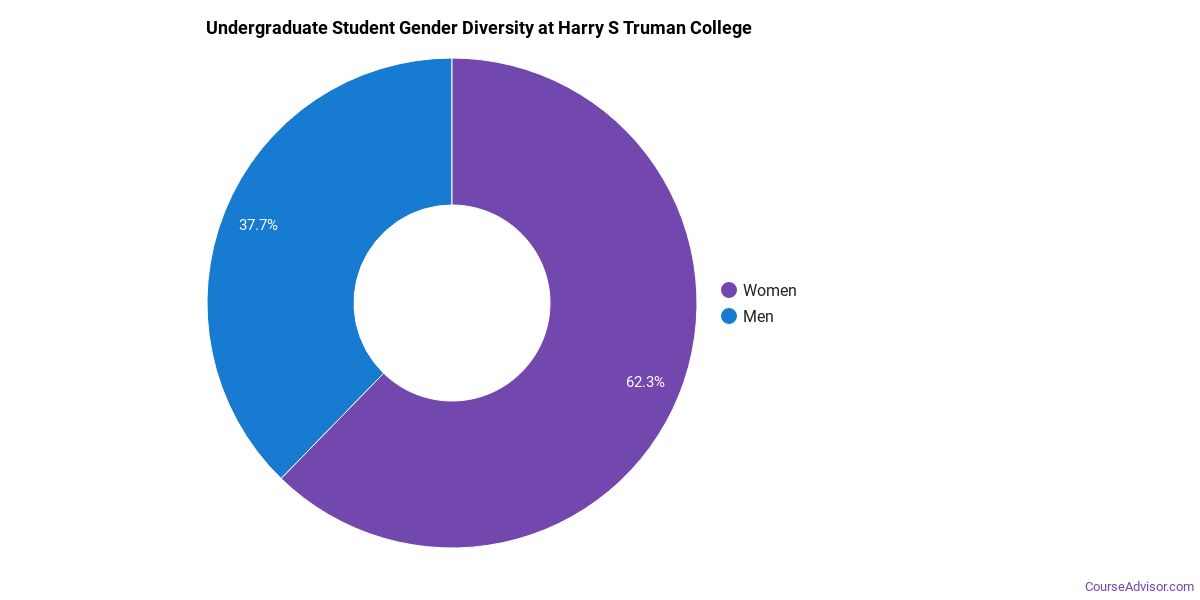
Gender Diversity
Of the 1,201 full-time undergraduates at Harry S Truman College, 38% are male and 62% are female.
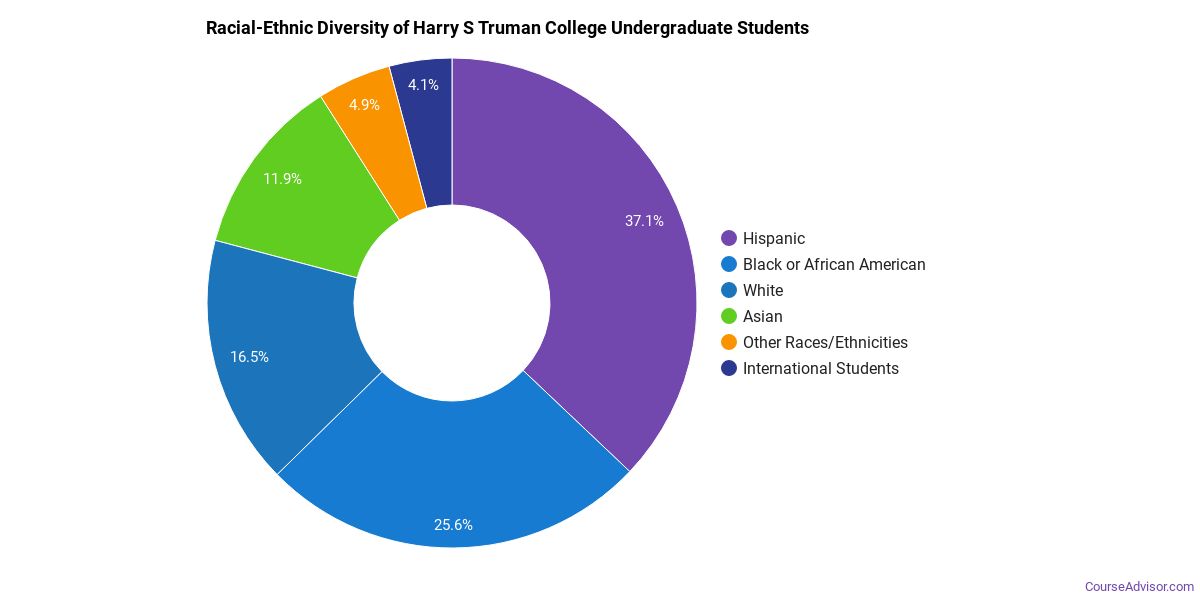
Racial-Ethnic Diversity
The racial-ethnic breakdown of City Colleges of Chicago - Harry S Truman College students is as follows.
| Race/Ethnicity | Number of Grads |
|---|---|
| Asian | 154 |
| Black or African American | 321 |
| Hispanic or Latino | 409 |
| White | 229 |
| International Students | 50 |
| Other Races/Ethnicities | 38 |
City Colleges of Chicago - Harry S Truman College Undergraduate Concentrations
The table below shows the number of awards for each concentration.
| Major | Basic Certificate | Associate’s | Undergraduate Certificate | TOTAL |
|---|---|---|---|---|
| Liberal Arts General Studies | 0 | 146 | 109 | 255 |
| Human Development & Family Studies | 63 | 12 | 27 | 102 |
| Biological & Physical Science | 0 | 80 | 0 | 80 |
| Cosmetology | 4 | 4 | 41 | 49 |
| General Education | 47 | 0 | 0 | 47 |
| Vehicle Maintenance & Repair | 20 | 11 | 14 | 45 |
| Accounting | 5 | 1 | 1 | 7 |
| Computer Systems Networking | 1 | 3 | 1 | 5 |
| Special Education | 5 | 0 | 0 | 5 |
| Information Science | 4 | 0 | 0 | 4 |
| Information Technology | 4 | 0 | 0 | 4 |
| General Engineering | 0 | 4 | 0 | 4 |
| Computer Programming | 3 | 0 | 0 | 3 |
| Business Administration & Management | 0 | 0 | 2 | 2 |
| Drafting & Design Engineering Technology | 1 | 0 | 0 | 1 |
| Criminal Justice & Corrections | 1 | 0 | 0 | 1 |
| Physical Science Technicians | 0 | 1 | 0 | 1 |
| Fine & Studio Arts | 0 | 1 | 0 | 1 |
| Marketing | 0 | 0 | 0 | 0 |
| Computer Information Systems | 0 | 0 | 0 | 0 |
| Instructional Media Design | 0 | 0 | 0 | 0 |
| Biology & Biotech Lab Technician | 0 | 0 | 0 | 0 |
| TOTAL | 158 | 263 | 195 | 616 |
References
*The racial-ethnic minorities count is calculated by taking the total number of students and subtracting white students, international students, and students whose race/ethnicity was unknown. This number is then divided by the total number of students at the school to obtain the racial-ethnic minorities percentage.
More about our data sources and methodologies.
Course Advisor provides higher-education, college and university, degree, program, career, salary, and other helpful information to students, faculty, institutions, and other internet audiences. Presented information and data are subject to change. Inclusion on this website does not imply or represent a direct relationship with the company, school, or brand. Information, though believed correct at time of publication, may not be correct, and no warranty is provided. Contact the schools to verify any information before relying on it. Financial aid may be available for those who qualify. The displayed options may include sponsored or recommended results, not necessarily based on your preferences.
© Course Advisor – All Rights Reserved.