City College - Fort Lauderdale Overview
City College - Fort Lauderdale is a private for-profit institution situated in Hollywood, Florida. City College - Fort Lauderdale is located in a safe and convenient suburb.
What Is City College - Fort Lauderdale Known For?
- The highest award offered at City College - Fort Lauderdale is the bachelor's degree.
- In a recent academic period15% of the faculty were full-time.
Where Is City College - Fort Lauderdale?
Contact details for City College - Fort Lauderdale are given below.
| Contact Details | |
|---|---|
| Address: | 6565 Taft Street, Suite 200, Hollywood, FL 33024-4045 |
| Phone: | 954-492-5353 |
| Website: | www.citycollege.edu |
Admission Requirements for City College - Fort Lauderdale
| Submission | Required? |
|---|---|
| High School GPA | 3 |
| High School Rank | 3 |
| High School Transcript | 3 |
| College Prep Program | 3 |
| Recommendations | 3 |
| SAT or ACT Scores | 3 |
| TOEFL | 3 |
Can I Afford City College - Fort Lauderdale?
Student Loan Debt
Almost 66% of college students who graduated with the class of 2018 took out student loans, but that percentage varies from school to school. At City College - Fort Lauderdale, approximately 80% of students took out student loans averaging $10,920 a year. That adds up to $43,680 over four years for those students.
Explore Best Ranked Schools for You
City College - Fort Lauderdale Undergraduate Student Diversity
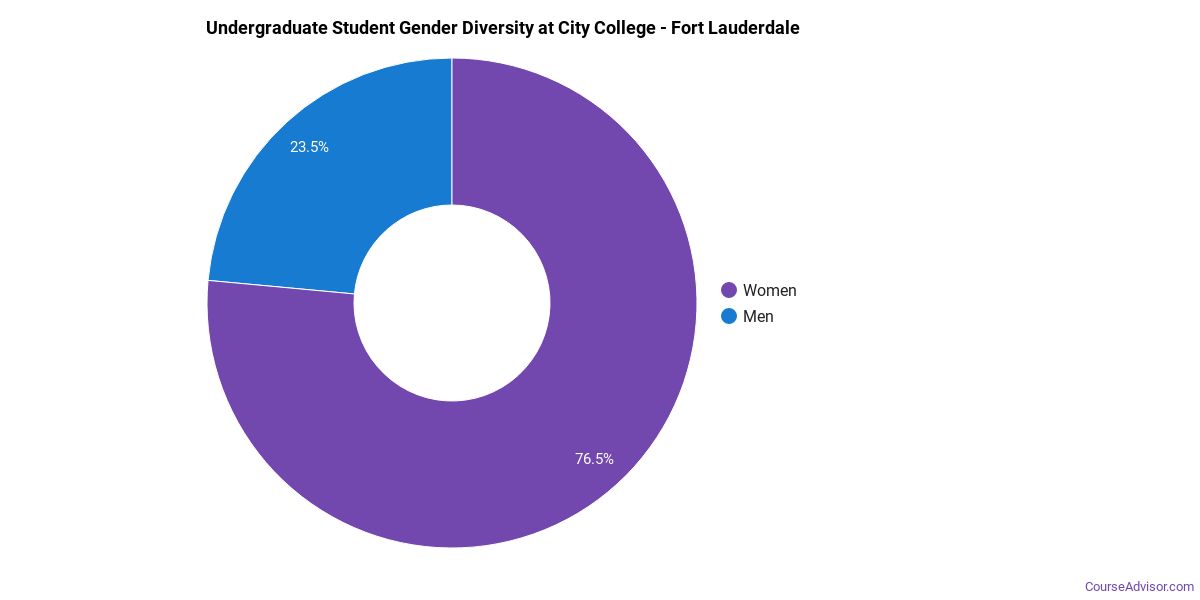
Gender Diversity
Of the 104 full-time undergraduates at City College - Fort Lauderdale, 32% are male and 68% are female.
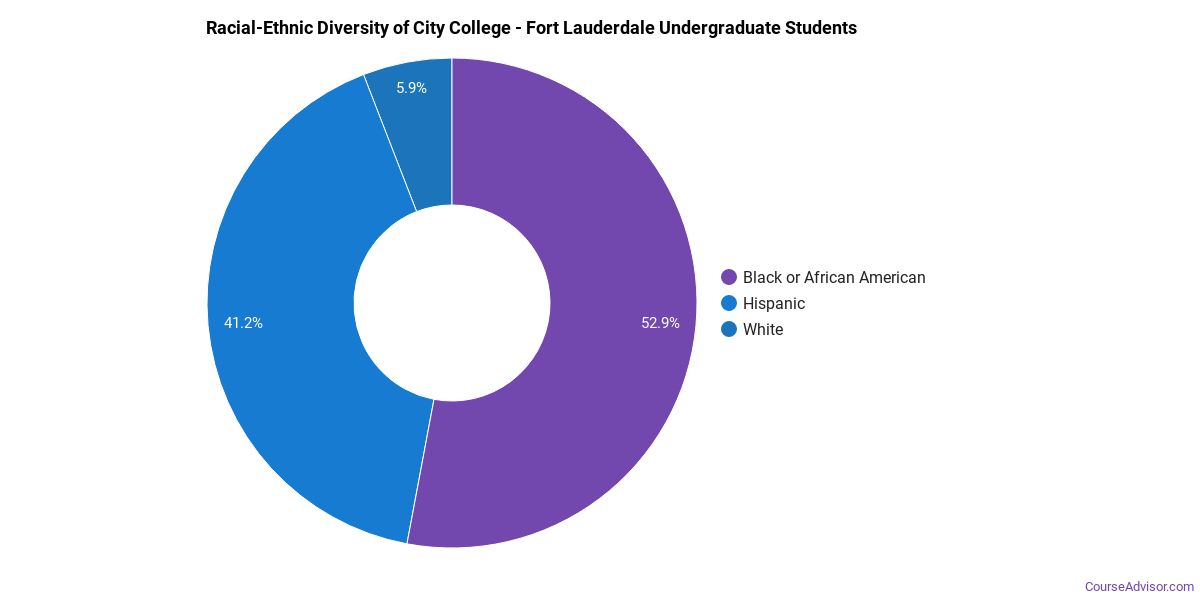
Racial-Ethnic Diversity
The racial-ethnic breakdown of City College - Fort Lauderdale students is as follows.
| Race/Ethnicity | Number of Grads |
|---|---|
| Asian | 1 |
| Black or African American | 70 |
| Hispanic or Latino | 19 |
| White | 7 |
| International Students | 0 |
| Other Races/Ethnicities | 7 |
City College - Fort Lauderdale Undergraduate Concentrations
The table below shows the number of awards for each concentration.
| Major | Basic Certificate | Associate’s | Bachelor’s | TOTAL |
|---|---|---|---|---|
| Allied Health Professions | 45 | 10 | 0 | 55 |
| Veterinary/Animal Health Technologies/Technicians | 0 | 17 | 0 | 17 |
| Health Sciences & Services | 0 | 5 | 0 | 5 |
| Health & Medical Administrative Services | 0 | 0 | 3 | 3 |
| Allied Health & Medical Assisting Services | 0 | 2 | 0 | 2 |
| Business Administration & Management | 0 | 0 | 1 | 1 |
| Audiovisual Communications | 0 | 0 | 0 | 0 |
| Legal Support Services | 0 | 0 | 0 | 0 |
| Criminal Justice & Corrections | 0 | 0 | 0 | 0 |
| TOTAL | 45 | 34 | 4 | 83 |
References
*The racial-ethnic minorities count is calculated by taking the total number of students and subtracting white students, international students, and students whose race/ethnicity was unknown. This number is then divided by the total number of students at the school to obtain the racial-ethnic minorities percentage.
More about our data sources and methodologies.
Course Advisor provides higher-education, college and university, degree, program, career, salary, and other helpful information to students, faculty, institutions, and other internet audiences. Presented information and data are subject to change. Inclusion on this website does not imply or represent a direct relationship with the company, school, or brand. Information, though believed correct at time of publication, may not be correct, and no warranty is provided. Contact the schools to verify any information before relying on it. Financial aid may be available for those who qualify. The displayed options may include sponsored or recommended results, not necessarily based on your preferences.
© Course Advisor – All Rights Reserved.