Chattanooga College Medical, Dental, and Technical Careers Overview
Located in Chattanooga, Tennessee, Chattanooga College Medical, Dental, and Technical Careers is a private for-profit institution. Chattanooga is a great location for students who prefer city over country life.
What Is Chattanooga College Medical, Dental, and Technical Careers Known For?
- The associate's degree is the highest award offered at Chattanooga College MDTC.
- In a recent academic period100% of the faculty were full-time.
Where Is Chattanooga College Medical, Dental, and Technical Careers?
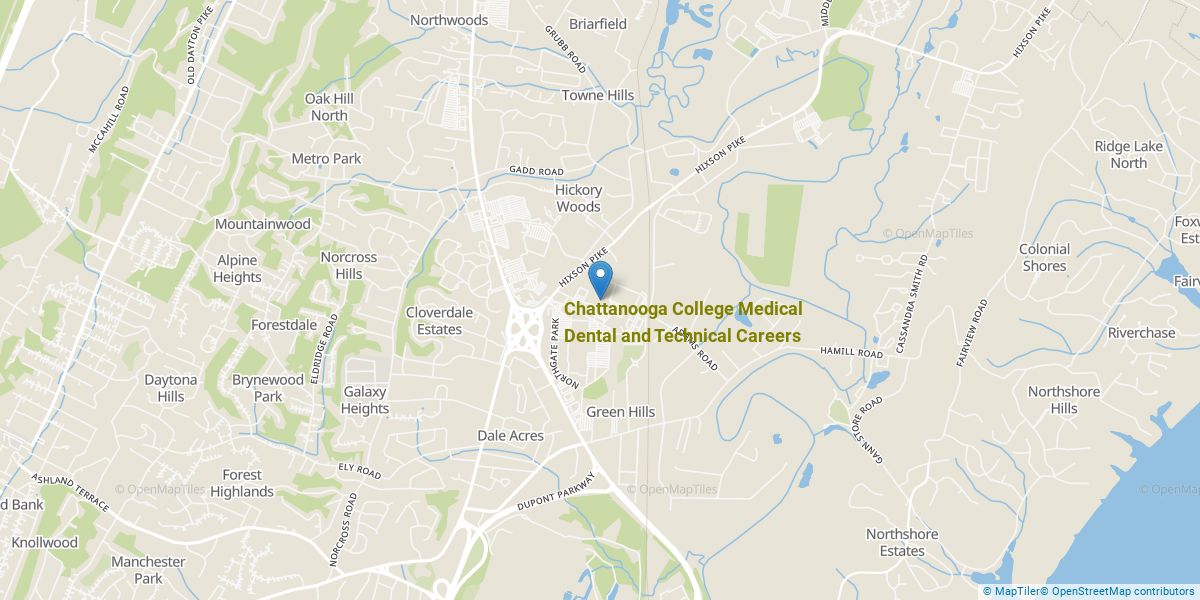
Contact details for Chattanooga College MDTC are given below.
| Contact Details | |
|---|---|
| Address: | 248 Northgate Mall Drive, Chattanooga, TN 37415 |
| Phone: | 423-305-7781 |
| Website: | www.chattanoogacollege.edu |
Can I Afford Chattanooga College Medical, Dental, and Technical Careers?
Student Loan Debt
While almost two-thirds of students nationwide take out loans to pay for college, the percentage may be quite different for the school you plan on attending. At Chattanooga College MDTC, approximately 81% of students took out student loans averaging $6,310 a year. That adds up to $25,240 over four years for those students.
Explore Best Ranked Schools for You
Chattanooga College Medical, Dental, and Technical Careers Undergraduate Student Diversity
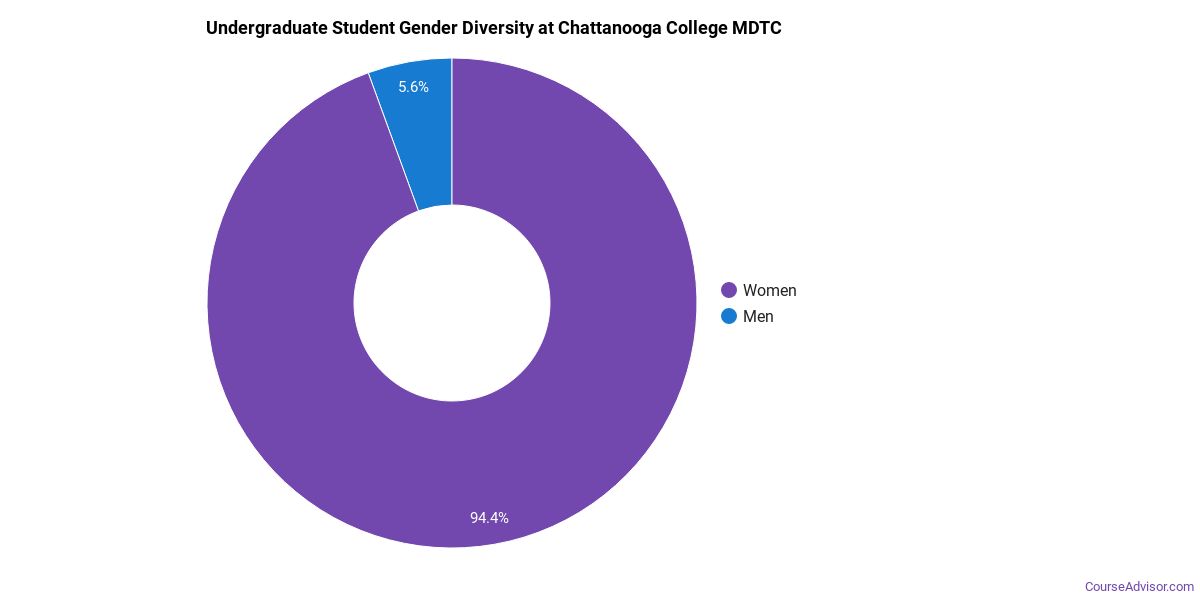
Gender Diversity
Of the 252 full-time undergraduates at Chattanooga College MDTC, 2% are male and 98% are female.
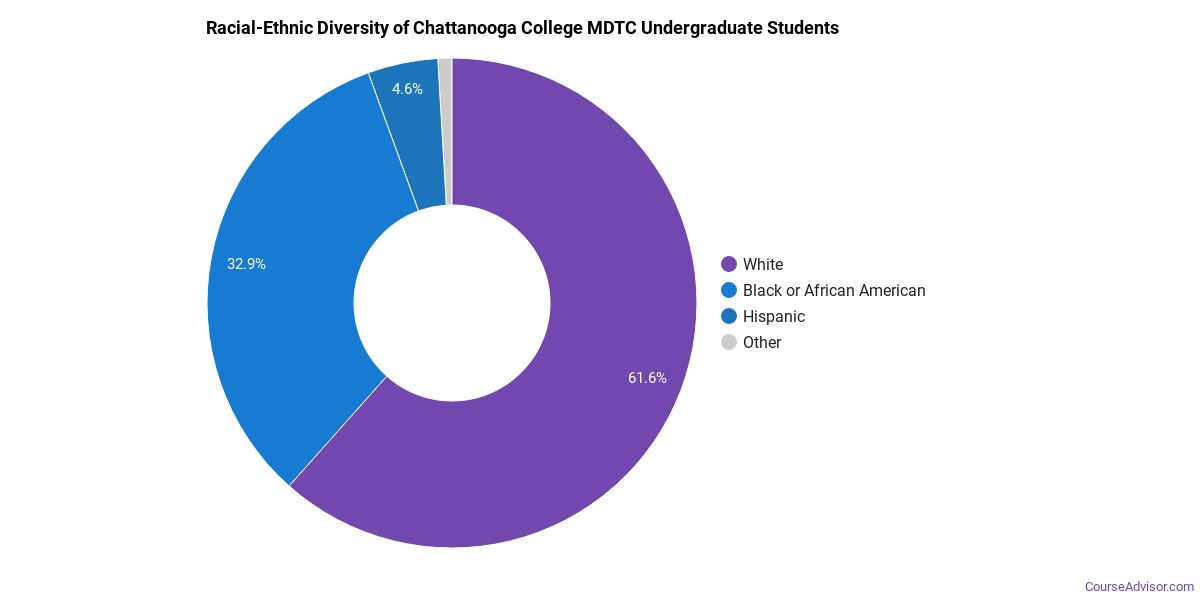
Racial-Ethnic Diversity
The racial-ethnic breakdown of Chattanooga College Medical, Dental, and Technical Careers students is as follows.
| Race/Ethnicity | Number of Grads |
|---|---|
| Asian | 0 |
| Black or African American | 77 |
| Hispanic or Latino | 16 |
| White | 157 |
| International Students | 0 |
| Other Races/Ethnicities | 2 |
Chattanooga College Medical, Dental, and Technical Careers Undergraduate Concentrations
The table below shows the number of awards for each concentration.
| Major | Basic Certificate | Associate’s | Undergraduate Certificate | TOTAL |
|---|---|---|---|---|
| Cosmetology | 94 | 0 | 19 | 113 |
| Practical Nursing & Nursing Assistants | 0 | 0 | 26 | 26 |
| Allied Health & Medical Assisting Services | 0 | 7 | 0 | 7 |
| Dental Support Services | 0 | 7 | 0 | 7 |
| Computer Systems Networking | 0 | 0 | 0 | 0 |
| Health & Medical Administrative Services | 0 | 0 | 0 | 0 |
| Criminal Justice & Corrections | 0 | 0 | 0 | 0 |
| TOTAL | 94 | 14 | 45 | 153 |
References
*The racial-ethnic minorities count is calculated by taking the total number of students and subtracting white students, international students, and students whose race/ethnicity was unknown. This number is then divided by the total number of students at the school to obtain the racial-ethnic minorities percentage.
More about our data sources and methodologies.
Course Advisor provides higher-education, college and university, degree, program, career, salary, and other helpful information to students, faculty, institutions, and other internet audiences. Presented information and data are subject to change. Inclusion on this website does not imply or represent a direct relationship with the company, school, or brand. Information, though believed correct at time of publication, may not be correct, and no warranty is provided. Contact the schools to verify any information before relying on it. Financial aid may be available for those who qualify. The displayed options may include sponsored or recommended results, not necessarily based on your preferences.
© Course Advisor – All Rights Reserved.