Liberal Arts General Studies at Champlain College
If you plan to study Liberal Arts General Studies, consider the program at Champlain College. Get started with the following essential facts.
Champlain College is located in Burlington, VT.
For the most recent IPEDS reporting year, 15 liberal arts general studies degrees were granted at Champlain College.
Featured schools near , edit
Online & Distance Learning at Champlain College
Many students take online classes at Champlain College. Of 3,259 students, 1,570 (48%) were enrolled entirely in distance education and 259 (8%) took at least some classes online.
Liberal Arts General Studies Rankings at Champlain College
Use these rankings to compare Champlain College’s Liberal Arts General Studies program to other colleges that offer this major.
Bachelor’s-Level Rankings
| Ranking | Scope | Rank |
|---|---|---|
| Best Schools (Quality) | Vermont | #2 of 5 |
| Best Value | Vermont | #4 of 5 |
| Best Schools (Quality) | New England (Region) | #10 of 69 |
| Best Value | New England (Region) | #64 of 70 |
| Best Schools (Quality) | Nationwide | #116 of 1,453 |
| Best Value | Nationwide | #1473 of 1,495 |
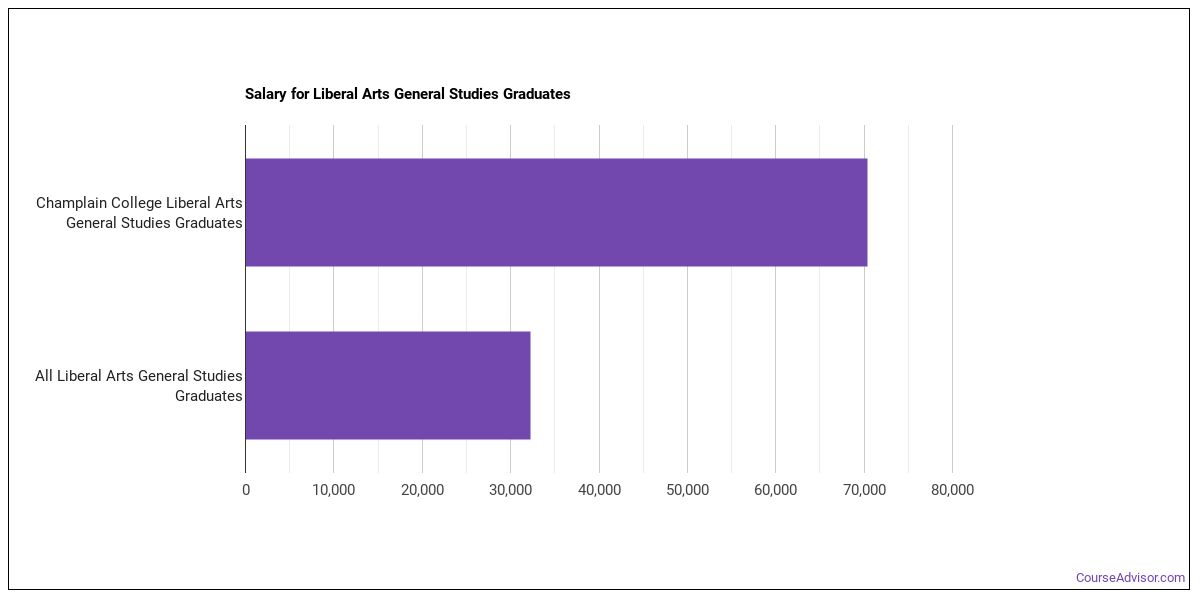
Earnings for Liberal Arts General Studies Graduates from Champlain College
Students who complete Champlain College’s Liberal Arts General Studies program report the following median earnings (per the U.S. Department of Education’s College Scorecard):
| Years After Graduation | Median Earnings |
|---|---|
| 1 year | $70,375 |
| 2 years | $43,798 |
| 5 years | $57,437 |
Median Debt at Graduation
The median debt for Liberal Arts General Studies graduates from Champlain College is $23,949.
Student Demographics & Diversity
Take a look at the student demographics for Liberal Arts General Studies graduates at Champlain College, by degree type.
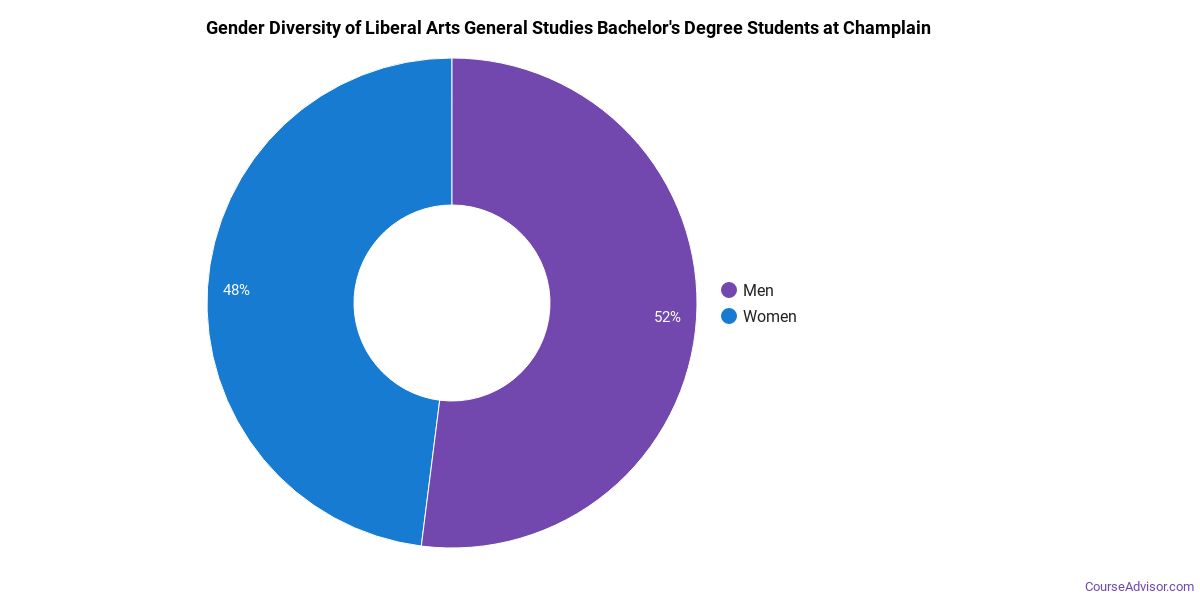
Program-wide, Liberal Arts General Studies graduates at Champlain College are 67% women (10) and 33% men (5).
Liberal Arts General Studies Bachelor’s Program at Champlain College
Of the 15 bachelor’s liberal arts general studies graduates at Champlain College, 67% were women (10) and 33% were men (5).
The following table and chart show the race/ethnicity of Liberal Arts General Studies bachelor’s degree recipients at Champlain College.
| Race / Ethnicity | Number of Graduates |
|---|---|
| White | 11 |
| Hispanic / Latino | 1 |
| Black / African American | 2 |
| Unknown | 1 |
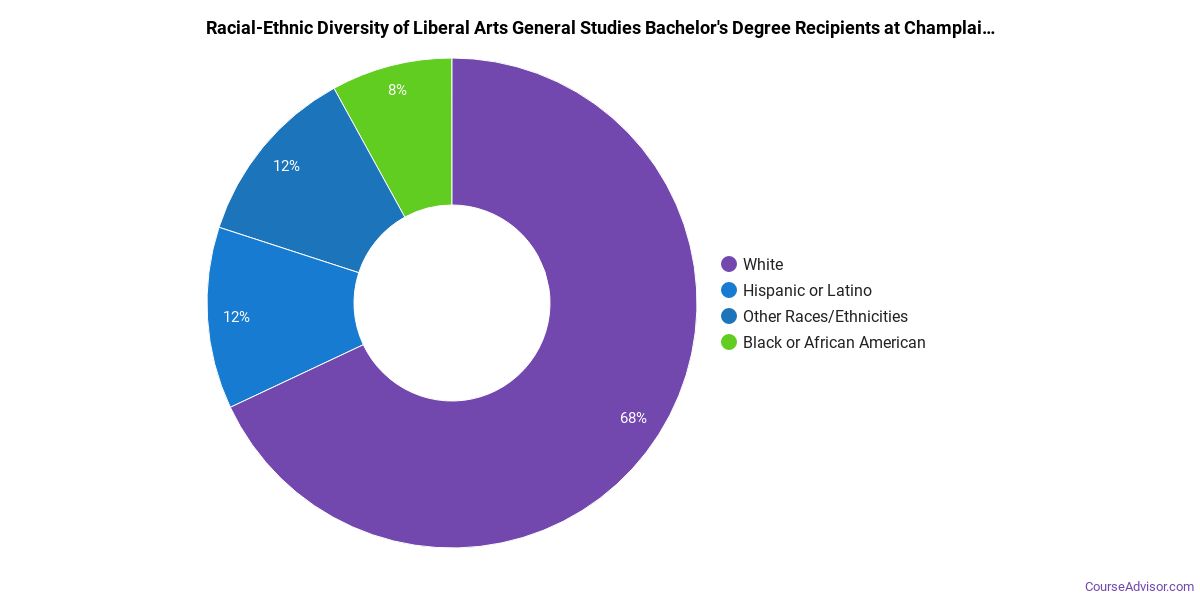
Minority students account for 20% of Liberal Arts General Studies bachelor’s degree recipients at Champlain College, lower than the national average of 43%.*
*The racial-ethnic minorities figure is the total number of graduates minus White, international (nonresident), and unknown-race graduates.
More Specific Liberal Arts General Studies Concentrations at Champlain College
The Liberal Arts General Studies program at Champlain College breaks down into more specific concentrations:
| Concentration | Graduates |
|---|---|
| Liberal Arts | 15 |
Best-Paid Careers for Liberal Arts General Studies Graduates
Graduates of the Liberal Arts General Studies program at Champlain College pursue many career paths. The table below ranks the top-paying careers for Liberal Arts General Studies majors, ordered by median annual salary:
| Occupation | Nationwide Median Wage |
|---|---|
| Postsecondary Teachers, All Other | $68,967 |
References
- IPEDS — Integrated Postsecondary Education Data System
- U.S. Department of Education — College Scorecard
- O*NET Online (Bureau of Labor Statistics)
- National Center for Education Statistics
More about our data sources and methodologies.
Course Advisor provides higher-education, college and university, degree, program, career, salary, and other helpful information to students, faculty, institutions, and other internet audiences. Presented information and data are subject to change. Inclusion on this website does not imply or represent a direct relationship with the company, school, or brand. Information, though believed correct at time of publication, may not be correct, and no warranty is provided. Contact the schools to verify any information before relying on it. Financial aid may be available for those who qualify. The displayed options may include sponsored or recommended results, not necessarily based on your preferences.
© Course Advisor – All Rights Reserved.