California Baptist University Science & Tech Programs
California Baptist University is a private not-for-profit institution located in Riverside, CA. A Major City Center offers an ideal setting with access to urban amenities.
Featured schools near , edit
California Baptist University Rankings
CBU appears in the following rankings for science & tech programs at the bachelors level:
| Ranking | Rank | Among |
|---|---|---|
| Overall Quality | #55 of 469 | State — California |
| Overall Quality | #74 of 667 | Region — Far Western |
| Overall Quality | #345 of 4,630 | Nationwide |
Where Is California Baptist University?
Get in touch with CBU are listed below.
| Contact Details | |
|---|---|
| Address: | 8432 Magnolia Ave, Riverside, CA 92504-3297 |
| Phone: | 8772283615 |
| Website: | www.calbaptist.edu/ |
| Admissions: | www.calbaptist.edu/admissions |
| Financial Aid: | www.calbaptist.edu/admissions-aid/tuition-aid/ |
How Do I Get Into CBU?
You can apply to CBU online at: www.calbaptist.edu/future-students/why-cbu/applying-cbu/
CBU is classified as Less Selective (70-85%) for admissions.
Admission Requirements for CBU
These are the things CBU looks for in applicants:
| Requirement | Status |
|---|---|
| Secondary School Record | Required |
| Secondary School GPA | Required |
| Recommendations | Considered but not required |
| Admission Test Scores (SAT/ACT) | Neither required nor recommended |
How Hard Is It To Get Into CBU?
CBU has an acceptance rate of 85%, making it highly accessible. Be sure to prepare a complete application and prepare the application in full.
Of those admitted, 24% choose to enroll — a typical enrollment-to-admission yield.
Average Test Scores
Selectivity by Gender
Acceptance rates at CBU can differ by gender.
| Gender | Applicants | Admitted | Acceptance Rate |
|---|---|---|---|
| Men | 2,830 | 2,363 | 84% |
| Women | 5,160 | 4,419 | 86% |
Can I Afford California Baptist University?
The average net price after aid at CBU is $27,384. The affordability of the school largely depends on your financial need since net price varies by income group.
Tuition & Fees
| Category | Cost |
|---|---|
| In-State Tuition | $39,078 |
| In-State Fees | $2,150 |
| Out-of-State Tuition | $39,078 |
| Out-of-State Fees | $2,150 |
| Total In-State Tuition & Fees | $41,228 |
| Total Out-of-State Tuition & Fees | $41,228 |
Financial Aid
Counting all forms of financial assistance, 16% of students at CBU receive some form of financial aid (1,258 students).
Approximately 95% of students at CBU receive grant or scholarship aid, averaging $21,853 per student.
42% of students receive federal Pell Grants, averaging $5,685.
Student Loan Debt
61% of CBU undergraduates take out federal student loans, averaging $7,418 per year.
California Baptist University Undergraduate Student Diversity
There are 4,332 students enrolled at CBU. CBU is classified as a 10,000 - 19,999 institution by enrollment size. Its Carnegie Classification is Master’s Colleges & Universities: Larger Programs.
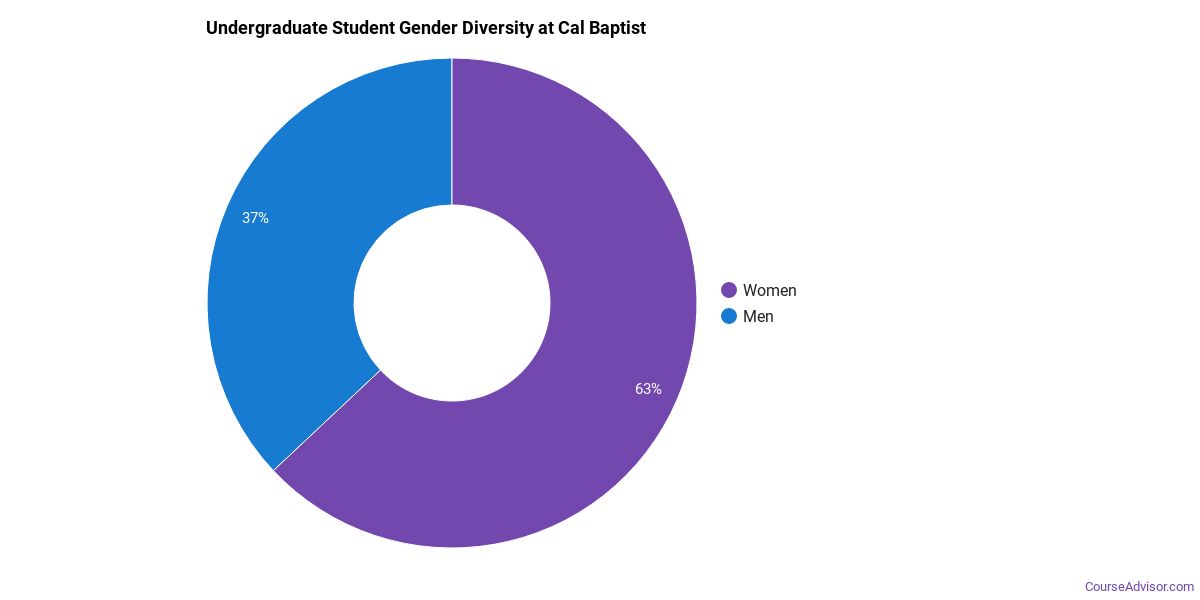
Gender Diversity
Of the 7,914 undergraduate students at CBU, approximately 38% are male and 62% are female.
Racial-Ethnic Diversity
The racial-ethnic breakdown of California Baptist University undergraduate students is as follows.

| Race/Ethnicity | Number of Students |
|---|---|
| Asian | 459 |
| Black or African American | 546 |
| Hispanic | 3,450 |
| White | 2,374 |
| American Indian/Alaska Native | 31 |
| Native Hawaiian/Pacific Islander | 39 |
| Two or More Races | 451 |
| Non-Resident | 142 |
Geographic Diversity
The top 5 home states of first-time undergraduate students at CBU break down as follows.

| State | First-Time UG Students |
|---|---|
| California | 1,434 |
| Washington | 27 |
| Oregon | 21 |
| Colorado | 13 |
| Arizona | 10 |
Additionally, approximately 1.8% of undergraduate students are non-resident from outside the United States.
California Baptist University Graduate Student Diversity
3,297 of CBU’s students are in graduate programs. The highest graduate-level award offered is Doctor’s degree.
Gender Diversity (Graduate)
Among graduate students at CBU, approximately 27% are male and 73% are female.

Racial-Ethnic Diversity (Graduate)
The racial-ethnic breakdown of California Baptist University graduate students is as follows.

| Race/Ethnicity | Number of Students |
|---|---|
| Asian | 260 |
| Black or African American | 379 |
| Hispanic | 1,453 |
| White | 738 |
| American Indian/Alaska Native | 9 |
| Native Hawaiian/Pacific Islander | 19 |
| Two or More Races | 118 |
| Non-Resident | 164 |
Online Learning at California Baptist University
CBU offers distance learning options for students who need flexibility.
3,175 undergraduate students at CBU took at least one online class — of those, 1,820 took all of their classes online.
At the graduate level, 764 students took at least one online class and 1,242 took all classes online. Distance education is available at the undergraduate and graduate levels.
Science & Tech Programs at California Baptist University
The following science & tech degree programs are offered by CBU, with per-level degree counts in the most recent reporting year.
| Program | Bachelor’s | Master’s | Doctorate | Total |
|---|---|---|---|---|
| Architectural Sciences and Technology | 26 | 26 | — | 52 |
Academic Programs at California Baptist University
CBU offers 25 distinct academic programs.
The highest level of award offered is Doctor’s degree.
Institutional Profile
CBU maintains an open admission policy: No. Credit transfer:
- AP credits: Yes
- Dual enrollment credits: Yes
- Life experience credits: Implied no
References
More about our data sources and methodologies.
Course Advisor provides higher-education, college and university, degree, program, career, salary, and other helpful information to students, faculty, institutions, and other internet audiences. Presented information and data are subject to change. Inclusion on this website does not imply or represent a direct relationship with the company, school, or brand. Information, though believed correct at time of publication, may not be correct, and no warranty is provided. Contact the schools to verify any information before relying on it. Financial aid may be available for those who qualify. The displayed options may include sponsored or recommended results, not necessarily based on your preferences.
© Course Advisor – All Rights Reserved.