Bryant & Stratton College - Buffalo Overview
Bryant & Stratton College - Buffalo is a private not-for-profit institution located in Buffalo, New York. The city atmosphere of Buffalo makes it a great place for students who enjoy having lots of educational and entertainment options.
What Is Bryant & Stratton College - Buffalo Known For?
- The bachelor's degree is the highest award offered at Bryant & Stratton College - Buffalo.
- During a recent academic cycle, 29% of the faculty were full-time.
Where Is Bryant & Stratton College - Buffalo?
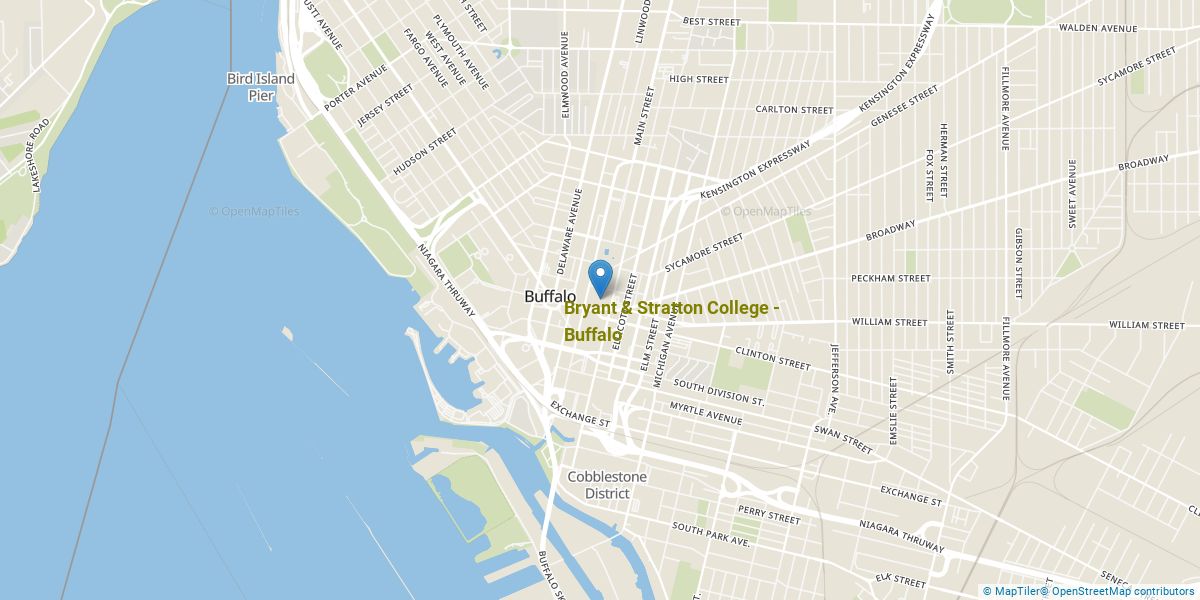
Contact details for Bryant & Stratton College - Buffalo are given below.
| Contact Details | |
|---|---|
| Address: | 110 Broadway, 2Nd Floor, Buffalo, NY 14203 |
| Phone: | 716-884-9120 |
| Website: | www.bryantstratton.edu |
How Do I Get Into Bryant & Stratton College - Buffalo?
You can apply to Bryant & Stratton College - Buffalo online at: https://www.bryantstratton.edu/utilities/applynew
Can I Afford Bryant & Stratton College - Buffalo?
Student Loan Debt
While almost two-thirds of students nationwide take out loans to pay for college, the percentage may be quite different for the school you plan on attending. At Bryant & Stratton College - Buffalo, approximately 59% of students took out student loans averaging $6,054 a year. That adds up to $24,216 over four years for those students.
Explore Best Ranked Schools for You
Bryant & Stratton College - Buffalo Undergraduate Student Diversity
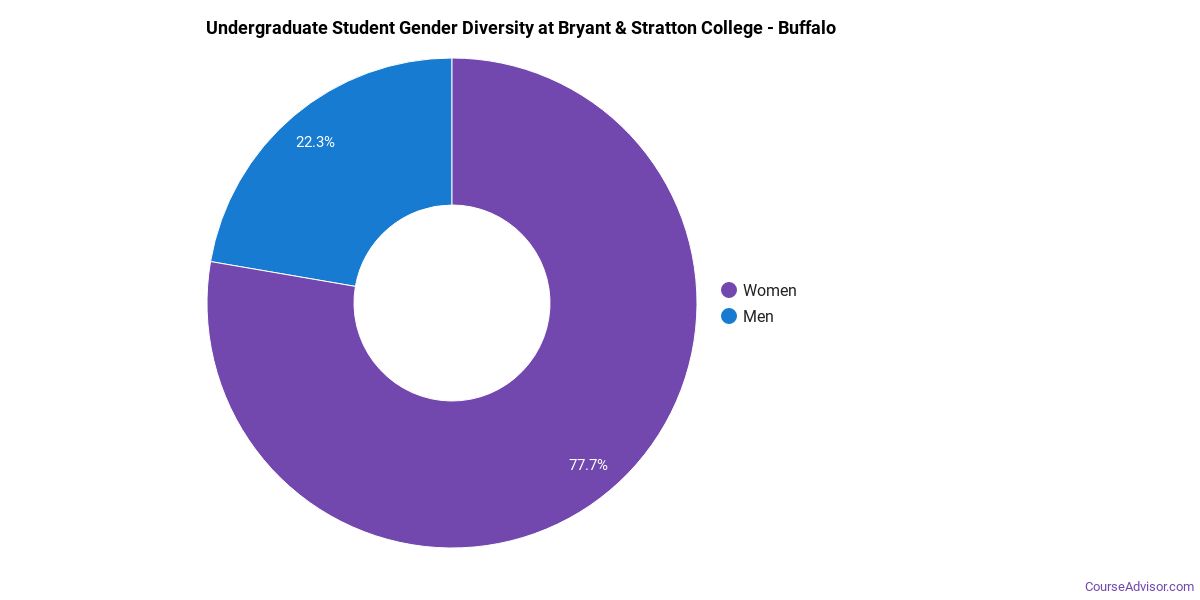
Gender Diversity
Of the 520 full-time undergraduates at Bryant & Stratton College - Buffalo, 24% are male and 76% are female.
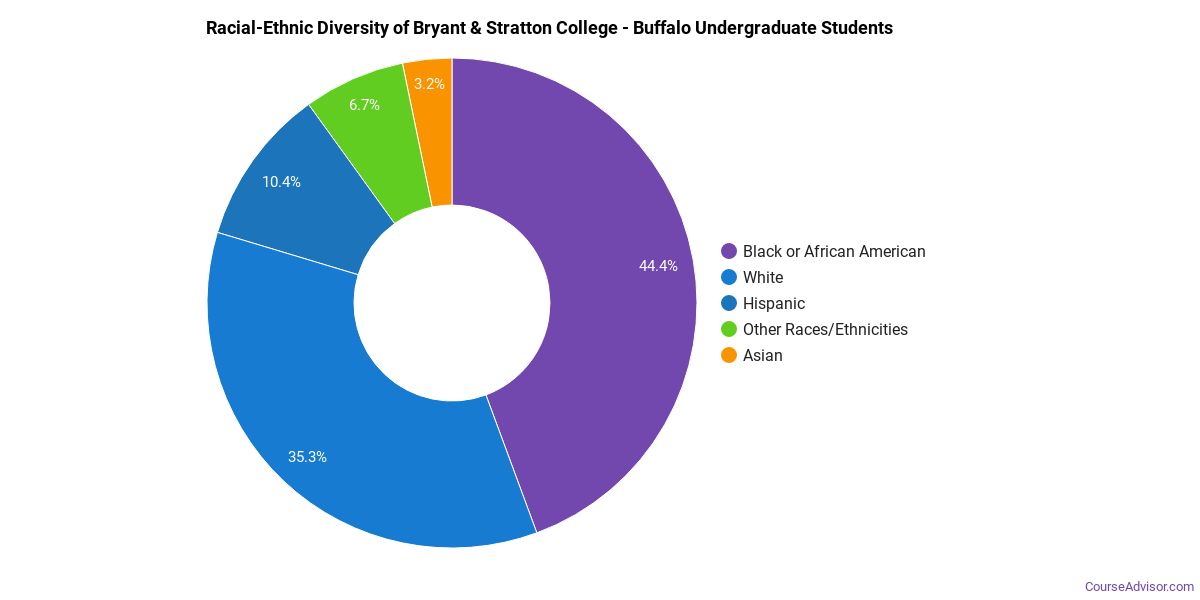
Racial-Ethnic Diversity
The racial-ethnic breakdown of Bryant & Stratton College - Buffalo students is as follows.
| Race/Ethnicity | Number of Grads |
|---|---|
| Asian | 8 |
| Black or African American | 222 |
| Hispanic or Latino | 51 |
| White | 204 |
| International Students | 0 |
| Other Races/Ethnicities | 35 |
Bryant & Stratton College - Buffalo Undergraduate Concentrations
The table below shows the number of awards for each concentration.
| Major | Associate’s | Undergraduate Certificate | Bachelor’s | TOTAL |
|---|---|---|---|---|
| Allied Health & Medical Assisting Services | 73 | 0 | 0 | 73 |
| Business Administration & Management | 0 | 0 | 48 | 48 |
| Health & Medical Administrative Services | 16 | 16 | 0 | 32 |
| General Business/Commerce | 24 | 7 | 0 | 31 |
| Criminal Justice & Corrections | 14 | 6 | 0 | 20 |
| Public Health | 4 | 0 | 11 | 15 |
| Accounting | 8 | 2 | 0 | 10 |
| Information Technology | 8 | 2 | 0 | 10 |
| Legal Support Services | 10 | 0 | 0 | 10 |
| Design & Applied Arts | 6 | 0 | 0 | 6 |
| Human Resource Management | 5 | 0 | 0 | 5 |
| Hospitality Management | 1 | 0 | 0 | 1 |
| Business Support & Assistant Services | 0 | 0 | 0 | 0 |
| Marketing | 0 | 0 | 0 | 0 |
| TOTAL | 169 | 33 | 59 | 261 |
References
*The racial-ethnic minorities count is calculated by taking the total number of students and subtracting white students, international students, and students whose race/ethnicity was unknown. This number is then divided by the total number of students at the school to obtain the racial-ethnic minorities percentage.
More about our data sources and methodologies.
Course Advisor provides higher-education, college and university, degree, program, career, salary, and other helpful information to students, faculty, institutions, and other internet audiences. Presented information and data are subject to change. Inclusion on this website does not imply or represent a direct relationship with the company, school, or brand. Information, though believed correct at time of publication, may not be correct, and no warranty is provided. Contact the schools to verify any information before relying on it. Financial aid may be available for those who qualify. The displayed options may include sponsored or recommended results, not necessarily based on your preferences.
© Course Advisor – All Rights Reserved.