Other Health Professions at Boston University
What traits are you looking for in a school for Other Health Professions, take a look at what Boston University. The following information will help you decide if it is a good fit for you.
Boston University sits in Boston, MA.
In the most recent year for which we have data, 52 other health professions degrees were awarded at Boston University.
Featured schools near , edit
Online Class Availability at Boston University
Online coursework is an option at Boston University. Among 37,737 students, 5,423 (14%) studied exclusively online and 1,354 (4%) took at least some classes online.
Other Health Professions Rankings at Boston University
Rankings can help you compare Boston University’s Other Health Professions program to other colleges that offer this major.
Bachelor’s-Level Rankings
| Ranking | Scope | Rank |
|---|---|---|
| Best Schools (Quality) | Massachusetts | #1 of 1 |
| Best Schools (Quality) | New England (Region) | #1 of 6 |
| Best Value | Massachusetts | #1 of 1 |
| Best Value | New England (Region) | #2 of 6 |
| Best Schools (Quality) | Nationwide | #12 of 111 |
| Best Value | Nationwide | #84 of 109 |
Master’s-Level Rankings
| Ranking | Scope | Rank |
|---|---|---|
| Best Schools (Quality) | Massachusetts | #1 of 1 |
| Best Schools (Quality) | New England (Region) | #1 of 6 |
| Best Value | Massachusetts | #1 of 1 |
| Best Value | New England (Region) | #2 of 6 |
| Best Schools (Quality) | Nationwide | #12 of 111 |
| Best Value | Nationwide | #84 of 109 |
Earnings for Other Health Professions Graduates from Boston University
Students who complete Boston University’s Other Health Professions program report the following median earnings (per the U.S. Department of Education’s College Scorecard):

| Years After Graduation | Median Earnings |
|---|---|
| 1 year | $101,869 |
| 4 years | $74,492 |
| 5 years | $79,591 |
How do these earnings stack up against the rest of the school? At the four-year mark, Other Health Professions graduates from Boston University report median earnings of $74,492, compared with $86,455 for all Boston University graduates — about 14% lower than the school-wide median.

Median Debt at Graduation
The median debt for Other Health Professions graduates from Boston University comes in at $26,773.
Student Demographics & Diversity
Below you’ll find the student demographics for Other Health Professions graduates at Boston University, by degree type.
Program-wide, Other Health Professions graduates at Boston University are 77% women (40) and 23% men (12).
Other Health Professions Bachelor’s Program at Boston University
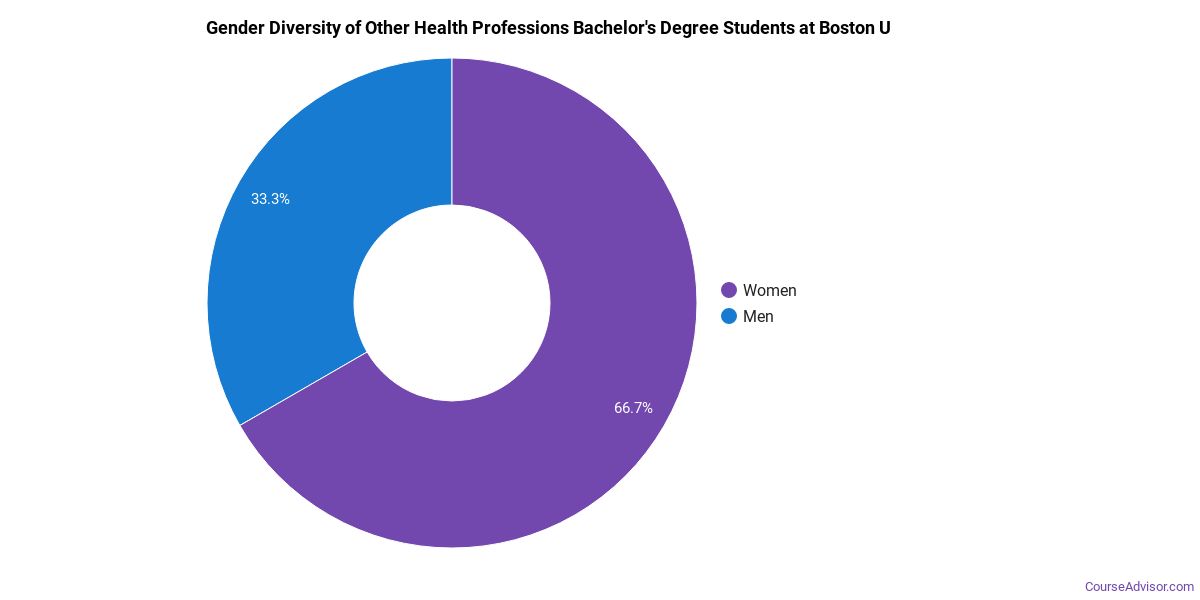
Of the 27 bachelor’s other health professions graduates at Boston University, 67% were women (18) and 33% were men (9).
The following table and chart show the race/ethnicity of Other Health Professions bachelor’s degree recipients at Boston University.
| Race / Ethnicity | Number of Graduates |
|---|---|
| White | 10 |
| Hispanic / Latino | 5 |
| Black / African American | 1 |
| Asian | 4 |
| Two or More Races | 1 |
| International (Nonresident) | 4 |
| Unknown | 2 |
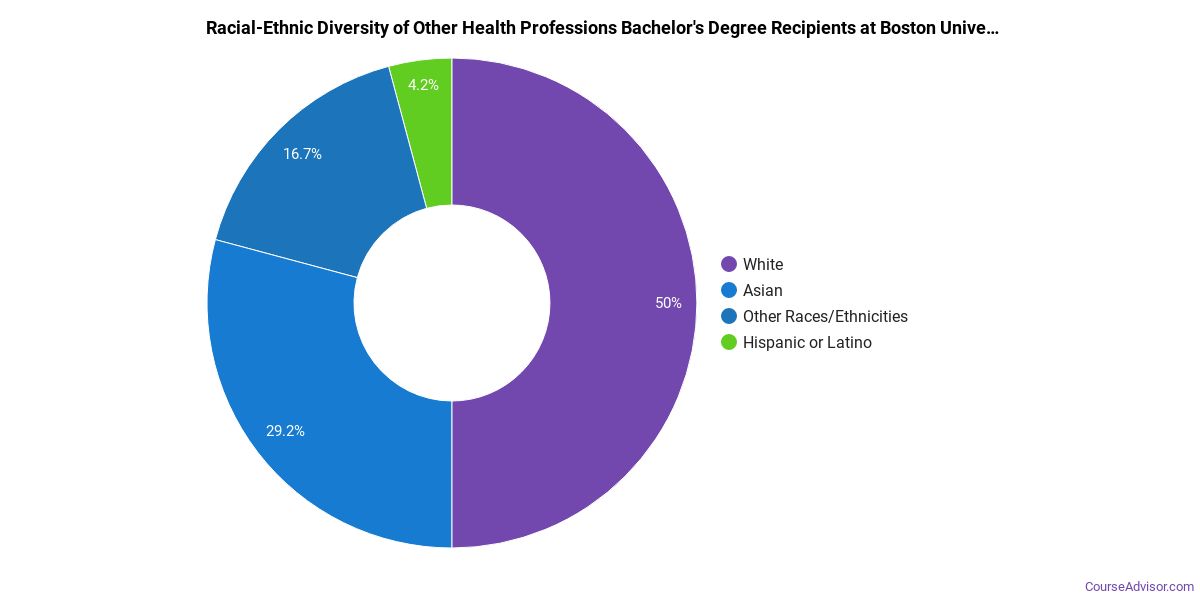
Minority students account for 41% of Other Health Professions bachelor’s degree recipients at Boston University, above the national average of 34%.*
Other Health Professions Master’s Program at Boston University
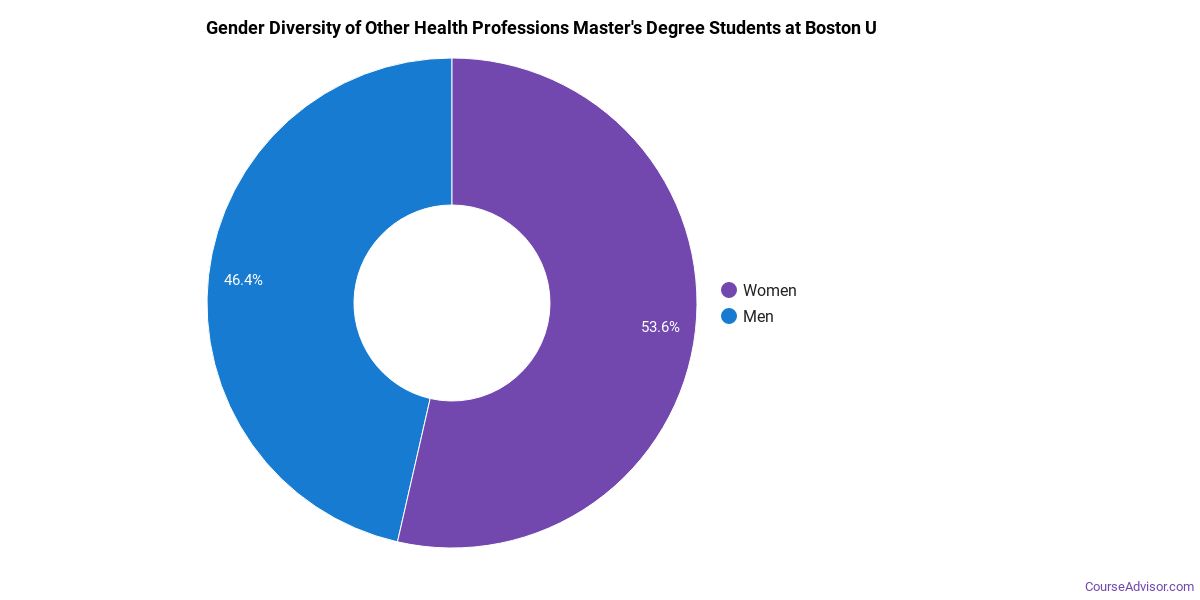
Of the 25 master’s other health professions degrees awarded at Boston University, 88% were women (22) and 12% were men (3).
The following table and chart show the race/ethnicity of Other Health Professions master’s degree recipients at Boston University.
| Race / Ethnicity | Number of Graduates |
|---|---|
| White | 8 |
| Hispanic / Latino | 3 |
| Black / African American | 1 |
| Asian | 9 |
| Unknown | 4 |
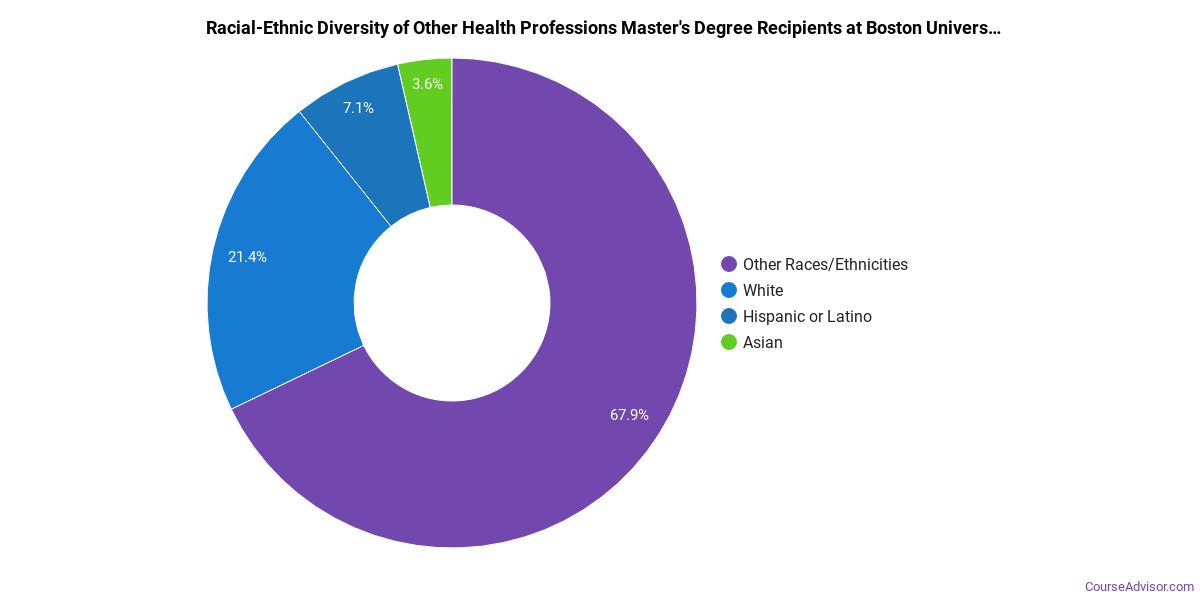
Racial-ethnic minorities make up 52% of Other Health Professions master’s degree recipients at Boston University, above the national average of 35%.*
*The racial-ethnic minorities figure is the total number of graduates minus White, international (nonresident), and unknown-race graduates.
More Specific Other Health Professions Concentrations at Boston University
The Other Health Professions program at Boston University breaks down into more specific concentrations:
| Concentration | Graduates |
|---|---|
| Other Health & Clinical Sciences | 52 |
References
- IPEDS — Integrated Postsecondary Education Data System
- U.S. Department of Education — College Scorecard
- O*NET Online (Bureau of Labor Statistics)
- National Center for Education Statistics
More about our data sources and methodologies.
Course Advisor provides higher-education, college and university, degree, program, career, salary, and other helpful information to students, faculty, institutions, and other internet audiences. Presented information and data are subject to change. Inclusion on this website does not imply or represent a direct relationship with the company, school, or brand. Information, though believed correct at time of publication, may not be correct, and no warranty is provided. Contact the schools to verify any information before relying on it. Financial aid may be available for those who qualify. The displayed options may include sponsored or recommended results, not necessarily based on your preferences.
© Course Advisor – All Rights Reserved.