Berks Career & Technology Center Overview
Located in Leesport, Pennsylvania, Berks Career & Technology Center is a public institution. Berks Career & Technology Center is located in a safe and convenient suburb.
What Is Berks Career & Technology Center Known For?
- Berks Career & Technology Center has an impressive student to faculty ratio of 1 to 1.
- The highest award offered at Berks Career & Technology Center is the undergraduate certificate.
Where Is Berks Career & Technology Center?
Contact details for Berks Career & Technology Center are given below.
| Contact Details | |
|---|---|
| Address: | 1057 County Road, Leesport, PA 19533-9112 |
| Phone: | 610-743-7630 |
| Website: | www.berkscareer.com |
How Do I Get Into Berks Career & Technology Center?
You can apply to Berks Career & Technology Center online at: www.berkscareer.com/ACE
Can I Afford Berks Career & Technology Center?
Student Loan Debt
While almost two-thirds of students nationwide take out loans to pay for college, the percentage may be quite different for the school you plan on attending. At Berks Career & Technology Center, approximately 50% of students took out student loans averaging $4,272 a year. That adds up to $17,088 over four years for those students.
The student loan default rate at Berks Career & Technology Center is 5.5%. This is significantly lower than the national default rate of 10.1%, which is a good sign that you'll be able to pay back your student loans.
Explore Best Ranked Schools for You
Berks Career & Technology Center Undergraduate Student Diversity
Gender Diversity
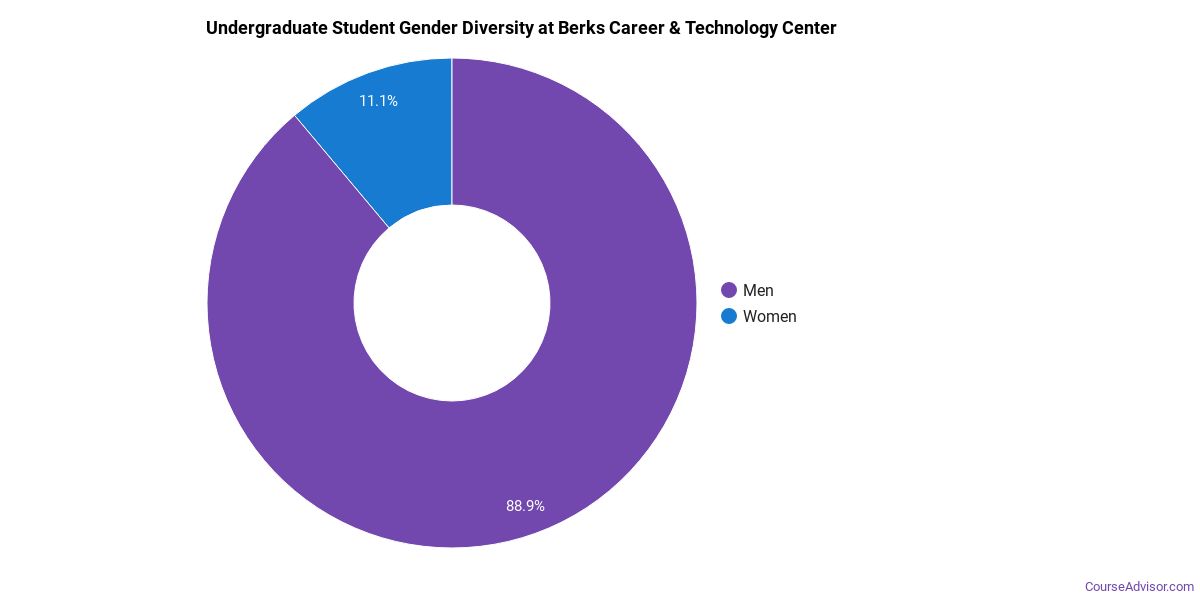
Of the 41 full-time undergraduates at Berks Career & Technology Center, 76% are male and 24% are female.
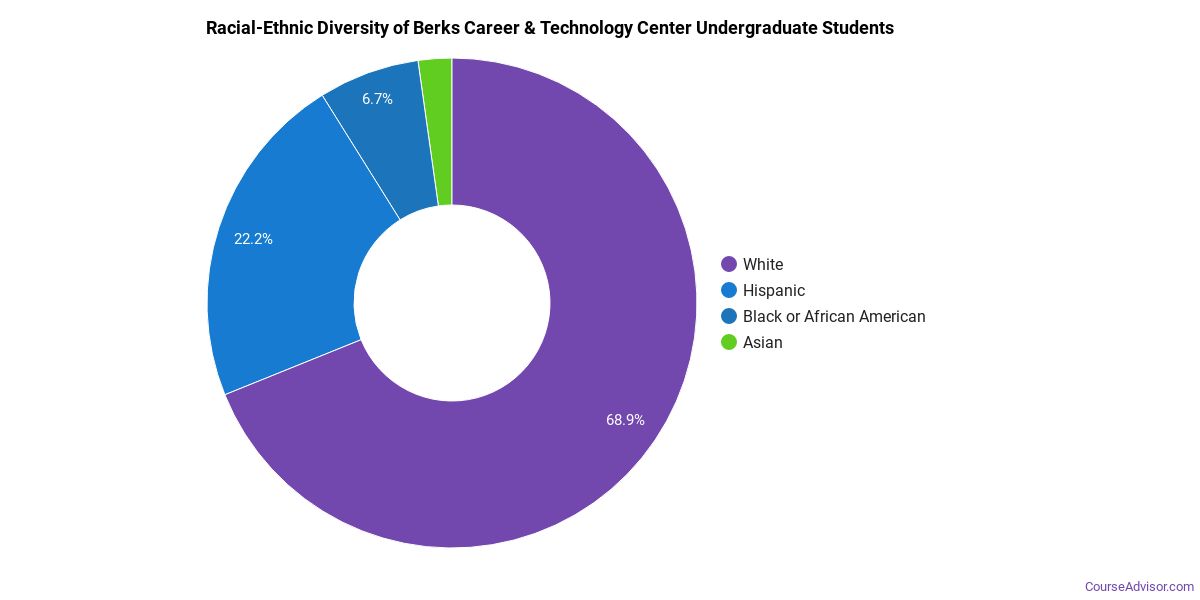
Racial-Ethnic Diversity
The racial-ethnic breakdown of Berks Career & Technology Center students is as follows.
| Race/Ethnicity | Number of Grads |
|---|---|
| Asian | 2 |
| Black or African American | 1 |
| Hispanic or Latino | 7 |
| White | 31 |
| International Students | 0 |
| Other Races/Ethnicities | 0 |
Berks Career & Technology Center Undergraduate Concentrations
The table below shows the number of awards for each concentration.
| Major | Undergraduate Certificate | TOTAL |
|---|---|---|
| Precision Metal Working | 5 | 5 |
| Vehicle Maintenance & Repair | 4 | 4 |
| Other Construction | 2 | 2 |
| Electronics Engineering Technology | 2 | 2 |
| Agricultural Economics & Business | 1 | 1 |
| Plumbing & Water Supply | 1 | 1 |
| Drafting & Design Engineering Technology | 1 | 1 |
| Cosmetology | 1 | 1 |
| Woodworking | 1 | 1 |
| General Sales & Marketing | 0 | 0 |
| Computer Systems Networking | 0 | 0 |
| Building Management & Inspection | 0 | 0 |
| Carpentry | 0 | 0 |
| Electrical & Power Transmission Installers | 0 | 0 |
| Masonry | 0 | 0 |
| Electromechanical Engineering Technology | 0 | 0 |
| Human Development & Family Studies | 0 | 0 |
| Allied Health & Medical Assisting Services | 0 | 0 |
| Dental Support Services | 0 | 0 |
| Heating, Air Conditioning, Ventilation & Refrigeration | 0 | 0 |
| Heavy/Industrial Equipment Maintenance | 0 | 0 |
| Culinary Arts | 0 | 0 |
| Criminal Justice & Corrections | 0 | 0 |
| Design & Applied Arts | 0 | 0 |
| Film, Video & Photographic Arts | 0 | 0 |
| TOTAL | 18 | 18 |
References
*The racial-ethnic minorities count is calculated by taking the total number of students and subtracting white students, international students, and students whose race/ethnicity was unknown. This number is then divided by the total number of students at the school to obtain the racial-ethnic minorities percentage.
More about our data sources and methodologies.
Course Advisor provides higher-education, college and university, degree, program, career, salary, and other helpful information to students, faculty, institutions, and other internet audiences. Presented information and data are subject to change. Inclusion on this website does not imply or represent a direct relationship with the company, school, or brand. Information, though believed correct at time of publication, may not be correct, and no warranty is provided. Contact the schools to verify any information before relying on it. Financial aid may be available for those who qualify. The displayed options may include sponsored or recommended results, not necessarily based on your preferences.
© Course Advisor – All Rights Reserved.