Berkeley College - Woodland Park Overview
Berkeley College - Woodland Park is a private for-profit institution situated in Woodland Park, New Jersey. Berkeley College - Woodland Park is located in a safe and convenient suburb.
What Is Berkeley College - Woodland Park Known For?
- The student loan default rate at Berkeley College - Woodland Park is 5%, which is significantly lower than the national rate of 10.1%. That's great news for students who are worrying about paying off their student loans.
- The highest award offered at Berkeley College - Woodland Park is the master's degree.
- For the <nil> academic year, 100% of the faculty were full-time.
Featured schools near , edit
Where Is Berkeley College - Woodland Park?

Contact details for Berkeley College - Woodland Park are given below.
| Contact Details | |
|---|---|
| Address: | 44 Rifle Camp Rd, Woodland Park, NJ 07424 |
| Phone: | 973-278-5400 |
| Website: | berkeleycollege.edu |
| Facebook: | https://www.facebook.com/BerkeleyCollegePage |
| Twitter: | https://twitter.com/berkeleycollege |
How Do I Get Into Berkeley College - Woodland Park?
You can apply to Berkeley College - Woodland Park online at: https://berkeleycollege.edu/admissions/apply/index.html
Can I Afford Berkeley College - Woodland Park?
Student Loan Debt
It's not uncommon for college students to take out loans to pay for school. In fact, almost 66% of students nationwide depend at least partially on loans. At Berkeley College - Woodland Park, approximately 53% of students took out student loans averaging $4,371 a year. That adds up to $17,484 over four years for those students.
The student loan default rate at Berkeley College - Woodland Park is 4.6%. This is significantly lower than the national default rate of 10.1%, which is a good sign that you'll be able to pay back your student loans.
Berkeley College - Woodland Park Undergraduate Student Diversity

There are also 122 graduate students at the school.
Gender Diversity
Of the 1,380 full-time undergraduates at Berkeley College - Woodland Park, 28% are male and 72% are female.

Racial-Ethnic Diversity
The racial-ethnic breakdown of Berkeley College - Woodland Park students is as follows.

| Race/Ethnicity | Number of Grads |
|---|---|
| Asian | 24 |
| Black or African American | 176 |
| Hispanic or Latino | 611 |
| White | 116 |
| International Students | 17 |
| Other Races/Ethnicities | 436 |
Geographic Diversity
New Jersey students aren't the only ones who study at Berkeley College - Woodland Park. At this time, 5 states are represented by the student population at the school.
Over 16 countries are represented at Berkeley College - Woodland Park. The most popular countries sending students to the school are China, Turkey, and India.
Online Learning at Berkeley College - Woodland Park
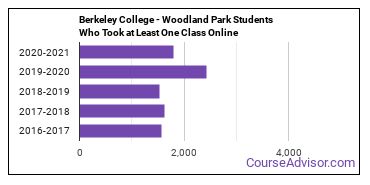
The following chart shows how the online learning population at Berkeley College - Woodland Park has changed over the last few years.

This school is the 2nd most popular in New Jersey for online learning according to the online graduations recorded by the Department of Education for the academic year 2020-2021.
Online Growth Rankings of Berkeley College - Woodland Park
The average growth rate over the last four years of online students at Berkeley College - Woodland Park was 21.0%. This is the #688 largest growth rate of all schools that are mostly online. This refers to all students at Berkeley College - Woodland Park regardless of major.
When we speak of partially online, we are referring to schools whose online population is less than 50% of its total student body. Mostly online refers to those with online populations greater than or equal to 50%.
References
*The racial-ethnic minorities count is calculated by taking the total number of students and subtracting white students, international students, and students whose race/ethnicity was unknown. This number is then divided by the total number of students at the school to obtain the racial-ethnic minorities percentage.
More about our data sources and methodologies.
Featured Schools
 Request Info
|
Southern New Hampshire University You have goals. Southern New Hampshire University can help you get there. Whether you need a bachelor's degree to get into a career or want a master's degree to move up in your current career, SNHU has an online program for you. Find your degree from over 200 online programs. Learn More > |
