Bay Mills Community College Overview
Bay Mills Community College is a public institution located in Brimley, Michigan. The rural area surrounding the school is great for students who prefer living in a country setting.
What Is Bay Mills Community College Known For?
- BMCC has an impressive student to faculty ratio of 8 to 1.
- Although it may not be available for every major, the bachelor's degree is the highest award a student can attain at BMCC.
- During a recent academic cycle, 21% of the faculty were full-time.
Where Is Bay Mills Community College?
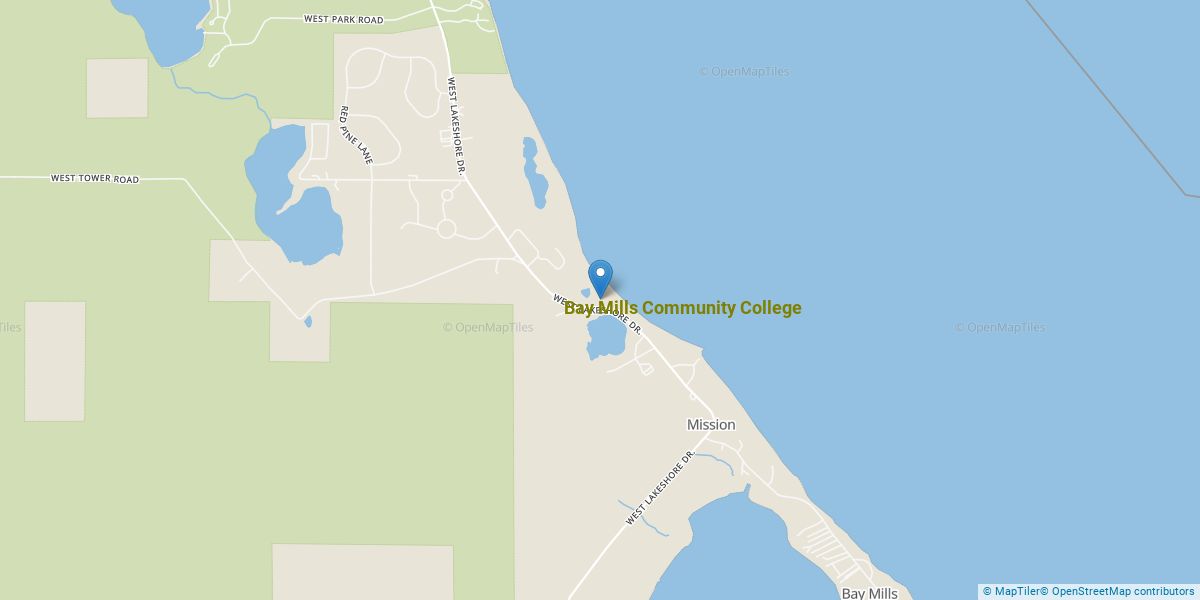
Contact details for BMCC are given below.
| Contact Details | |
|---|---|
| Address: | 12214 W Lakeshore Dr, Brimley, MI 49715 |
| Phone: | 906-248-3354 |
| Website: | www.bmcc.edu |
Can I Afford Bay Mills Community College?
Explore Best Ranked Schools for You
Bay Mills Community College Undergraduate Student Diversity
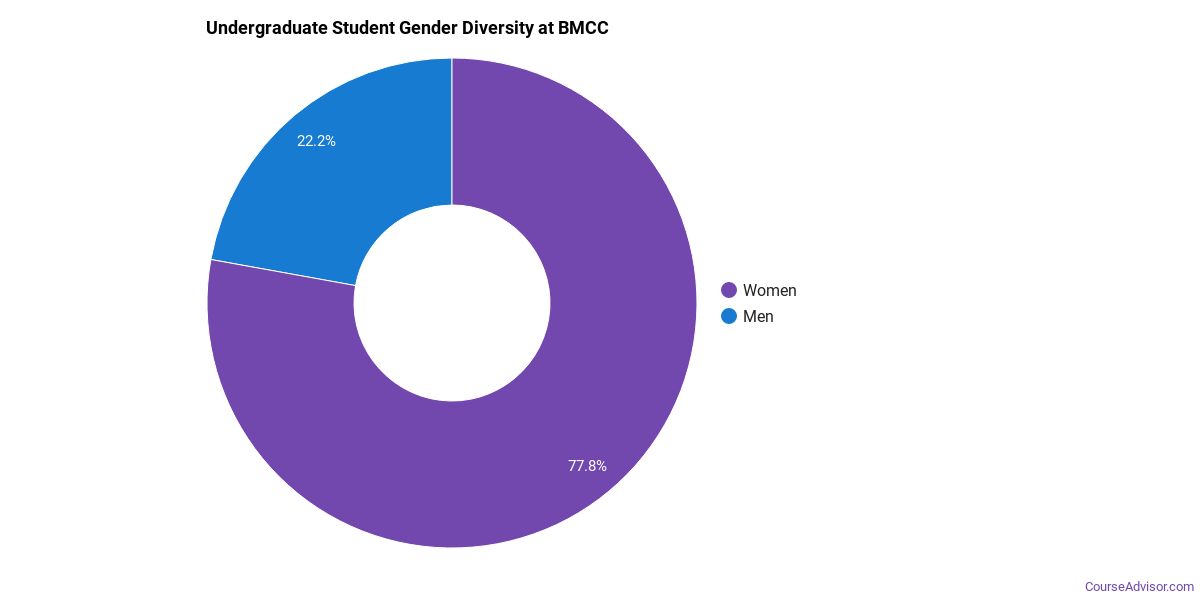
Gender Diversity
Of the 162 full-time undergraduates at BMCC, 20% are male and 80% are female.
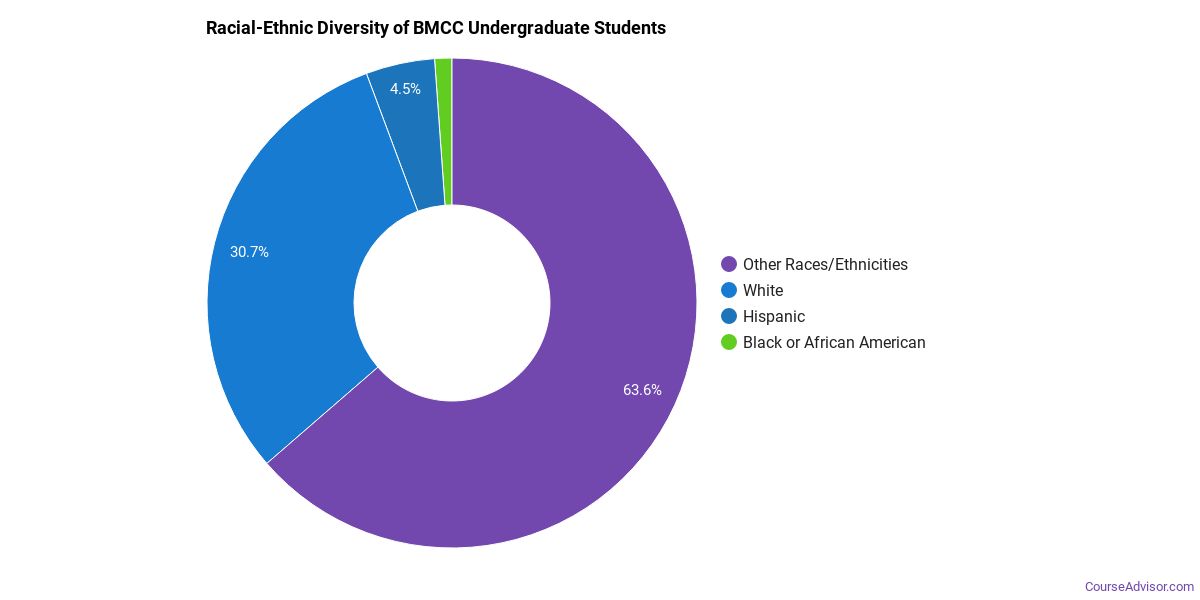
Racial-Ethnic Diversity
The racial-ethnic breakdown of Bay Mills Community College students is as follows.
| Race/Ethnicity | Number of Grads |
|---|---|
| Asian | 0 |
| Black or African American | 4 |
| Hispanic or Latino | 3 |
| White | 47 |
| International Students | 0 |
| Other Races/Ethnicities | 108 |
Bay Mills Community College Undergraduate Concentrations
The table below shows the number of awards for each concentration.
| Major | Basic Certificate | Associate’s | Undergraduate Certificate | Bachelor’s | TOTAL |
|---|---|---|---|---|---|
| Other Education | 32 | 0 | 0 | 0 | 32 |
| Teacher Education Grade Specific | 0 | 16 | 0 | 12 | 28 |
| Liberal Arts General Studies | 0 | 3 | 9 | 0 | 12 |
| Practical Nursing & Nursing Assistants | 9 | 0 | 0 | 0 | 9 |
| Business Administration & Management | 0 | 8 | 0 | 0 | 8 |
| Business Support & Assistant Services | 0 | 4 | 0 | 0 | 4 |
| Allied Health & Medical Assisting Services | 4 | 0 | 0 | 0 | 4 |
| Health & Medical Administrative Services | 3 | 0 | 1 | 0 | 4 |
| General Social Sciences | 0 | 4 | 0 | 0 | 4 |
| Computer Information Systems | 0 | 2 | 0 | 0 | 2 |
| Computer Software & Applications | 0 | 2 | 0 | 0 | 2 |
| Health Sciences & Services | 0 | 2 | 0 | 0 | 2 |
| Native American Languages | 0 | 0 | 1 | 0 | 1 |
| Criminal Justice & Corrections | 1 | 0 | 0 | 0 | 1 |
| Construction | 0 | 0 | 0 | 0 | 0 |
| Teacher Education Subject Specific | 0 | 0 | 0 | 0 | 0 |
| Ethnic Studies | 0 | 0 | 0 | 0 | 0 |
| Allied Health Professions | 0 | 0 | 0 | 0 | 0 |
| Natural Resources Conservation | 0 | 0 | 0 | 0 | 0 |
| Health & Physical Education | 0 | 0 | 0 | 0 | 0 |
| TOTAL | 49 | 41 | 11 | 12 | 113 |
References
*The racial-ethnic minorities count is calculated by taking the total number of students and subtracting white students, international students, and students whose race/ethnicity was unknown. This number is then divided by the total number of students at the school to obtain the racial-ethnic minorities percentage.
More about our data sources and methodologies.
Course Advisor provides higher-education, college and university, degree, program, career, salary, and other helpful information to students, faculty, institutions, and other internet audiences. Presented information and data are subject to change. Inclusion on this website does not imply or represent a direct relationship with the company, school, or brand. Information, though believed correct at time of publication, may not be correct, and no warranty is provided. Contact the schools to verify any information before relying on it. Financial aid may be available for those who qualify. The displayed options may include sponsored or recommended results, not necessarily based on your preferences.
© Course Advisor – All Rights Reserved.