Switchboard Operators, Including Answering Service in Kentucky
Want to work as a Switchboard Operators, Including Answering Service in Kentucky? Here’s what you need to know. Operate telephone business systems equipment or switchboards to relay incoming, outgoing, and interoffice calls. May supply information to callers and record messages.
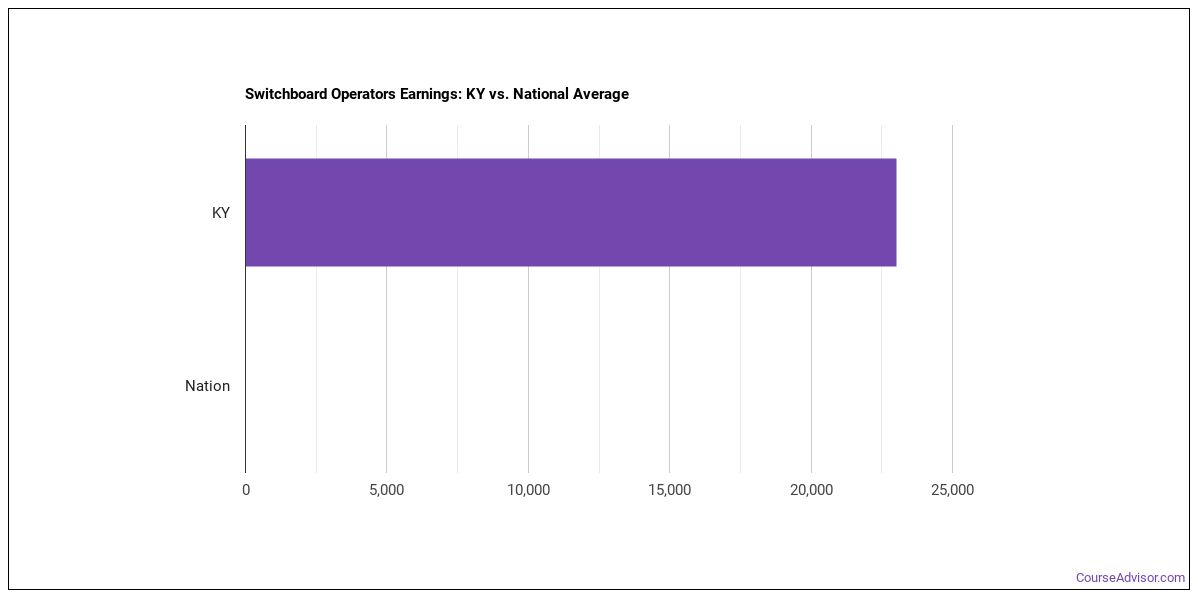
What do Switchboard Operators, Including Answering Service Make in Kentucky?
For a switchboard operators, including answering service working in Kentucky, wages run about $36,500 per year (or roughly $17.55/hour).Pay can range from $27,240 at the 10th percentile to $46,480 at the 90th percentile.
| Wage Statistic | Annual | Hourly |
|---|---|---|
| 10th percentile | $27,240 | $13.09 |
| 25th percentile | $30,620 | $14.72 |
| Median (50th) | $36,500 | $17.55 |
| 75th percentile | $39,160 | $18.83 |
| 90th percentile | $46,480 | $22.35 |

The location quotient — a measure of how concentrated this occupation is in Kentucky compared to the national average — is 0.75, indicating fewer switchboard operators, including answering service per worker than the national average.
National Wage Comparison
Nationally, switchboard operators, including answering service earn a median of $52,135 per year ($25.06/hour), below the Kentucky median.
Employment Outlook
Nationally, total employment in this occupation is 760,791 switchboard operators, including answering service nationwide. In Kentucky alone, around 350 people work in this role. That trails the typical state, which employs around 370 switchboard operators, including answering service.


Top Kentucky Metros for Switchboard Operators, Including Answering Service
These are the Kentucky metros with the most switchboard operators, including answering service in Kentucky.
| Metro Area | Number Employed | Annual Median Salary |
|---|---|---|
| Louisville/Jefferson County, KY-IN | 90 | $37,970 |
| Lexington-Fayette, KY | 50 | $35,950 |
Top States for Switchboard Operators, Including Answering Service Employment
View the states that employ the most switchboard operators, including answering service work.
| State | Number Employed |
|---|---|
| California | 7,170 |
| Florida | 2,940 |
| Texas | 2,860 |
| New York | 2,070 |
| Illinois | 1,830 |
| Pennsylvania | 1,240 |
| Massachusetts | 1,010 |
| Missouri | 880 |
| Louisiana | 870 |
| Tennessee | 870 |
| Nevada | 850 |
| Alabama | 820 |
| Ohio | 800 |
| North Carolina | 740 |
| New Jersey | 730 |
| Puerto Rico | 690 |
| Georgia | 680 |
| South Carolina | 630 |
| Arizona | 560 |
| Maryland | 530 |
Highest-Paying States for Switchboard Operators, Including Answering Service
The highest-paying states for switchboard operators, including answering service.
| State | Annual Median Salary |
|---|---|
| Hawaii | $57,220 |
| District of Columbia | $55,140 |
| California | $49,460 |
| Oregon | $49,440 |
| Minnesota | $48,280 |
| Washington | $46,470 |
| New York | $45,030 |
| Colorado | $42,740 |
| Maine | $42,090 |
| Montana | $41,880 |
Skills
Top switchboard operators, including answering service skills, rated on an importance scale of 0 to 5:
Knowledge Areas
Important knowledge areas for this occupation, rated on an importance scale of 0 to 5:
Abilities
Key abilities for switchboard operators, including answering service, rated on an importance scale of 0 to 5:
Daily Tasks
Switchboard Operators, Including Answering Service typically:
- Operate communication systems, such as telephone, switchboard, intercom, two-way radio, or public address.
- Answer incoming calls, greeting callers, providing information, transferring calls or taking messages as necessary.
- Greet visitors, log them in and out of the facility, assign them security badges, and contact employee escorts.
- Monitor emergency and code alarms, make emergency announcements, or route emergency calls to the appropriate location.
- Record messages, suggesting rewording for clarity or conciseness.
- Page individuals to inform them of telephone calls, using paging or interoffice communication equipment.
- Relay or route written or verbal messages.
- Perform various cash handling tasks, such as collecting payments, making bank deposits, or managing petty cash.
- Place telephone calls or arrange conference calls as instructed.
- Process incoming or outgoing mail, packages, or deliveries.
- Perform various data entry or word processing tasks, such as updating phone directories, typing or proofreading documents, or creating schedules.
- Perform administrative tasks, such as accepting orders, scheduling appointments or meeting rooms, or sending and receiving faxes.
Work Activities
- Getting Information
- Identifying Objects, Actions, and Events
- Communicating with Supervisors, Peers, or Subordinates
- Performing for or Working Directly with the Public
- Working with Computers
- Performing Administrative Activities
- Evaluating Information to Determine Compliance with Standards
- Processing Information
- Documenting/Recording Information
- Establishing and Maintaining Interpersonal Relationships
- Updating and Using Relevant Knowledge
- Monitoring Processes, Materials, or Surroundings
Tools & Technology
Technologies frequently used: Hot technologies: Microsoft Access In-demand technologies: Microsoft Excel
Related Careers
Related occupations to switchboard operators, including answering service include:
- Telecommunications Engineering Specialists
- Telemarketers
- First-Line Supervisors of Office and Administrative Support Workers
- Telephone Operators
- Billing and Posting Clerks
- Brokerage Clerks
Also Known As
Answering Service Telephone Operator, CBX Operator (Computerized Branch Exchange Operator), Central Communications Specialist, Combination Operator, Command and Control Specialist, Communication Center Operator, Communications Coordinator, Communications Operator, Communications Specialist, Complaint Operator, Desk Operator, Exchange Operator, Information Specialist, Line Technician, Operator.
References
- U.S. Bureau of Labor Statistics, Occupational Employment and Wage Statistics — https://www.bls.gov/oes/
- O*NET Online — https://www.onetonline.org/
- BLS Employment Projections — https://www.bls.gov/emp/
- O*NET-SOC code: 43-2011.00
Course Advisor provides higher-education, college and university, degree, program, career, salary, and other helpful information to students, faculty, institutions, and other internet audiences. Presented information and data are subject to change. Inclusion on this website does not imply or represent a direct relationship with the company, school, or brand. Information, though believed correct at time of publication, may not be correct, and no warranty is provided. Contact the schools to verify any information before relying on it. Financial aid may be available for those who qualify. The displayed options may include sponsored or recommended results, not necessarily based on your preferences.
© Course Advisor – All Rights Reserved.