Operations Research Analysts in Iowa
Thinking about a career as an Operations Research Analysts in Iowa? Below are the key facts. Formulate and apply mathematical modeling and other optimizing methods to develop and interpret information that assists management with decisionmaking, policy formulation, or other managerial functions. May collect and analyze data and develop decision support software, services, or products. May develop and supply optimal time, cost, or logistics networks for program evaluation, review, or implementation.
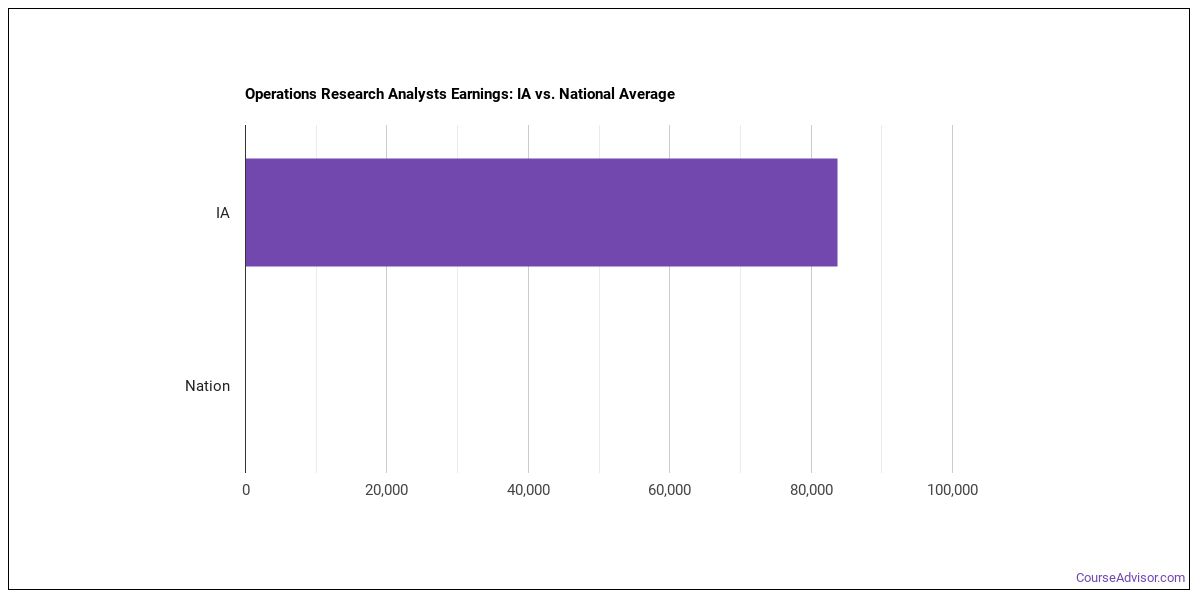
What do Operations Research Analysts Make in Iowa?
For operations research analysts working in Iowa, the median annual wage is $78,140 per year (or roughly $37.57/hour).Earnings range from $38,600 at the 10th percentile to $136,700 at the 90th percentile.
| Wage Statistic | Annual | Hourly |
|---|---|---|
| 10th percentile | $38,600 | $18.56 |
| 25th percentile | $59,730 | $28.71 |
| Median (50th) | $78,140 | $37.57 |
| 75th percentile | $117,920 | $56.69 |
| 90th percentile | $136,700 | $65.72 |

The job concentration index in Iowa nationwide is 0.32, meaning fewer operations research analysts per worker than the national average.
National Wage Comparison
Nationally, operations research analysts earn a median of $83,596 per year ($40.19/hour), below the Iowa median.
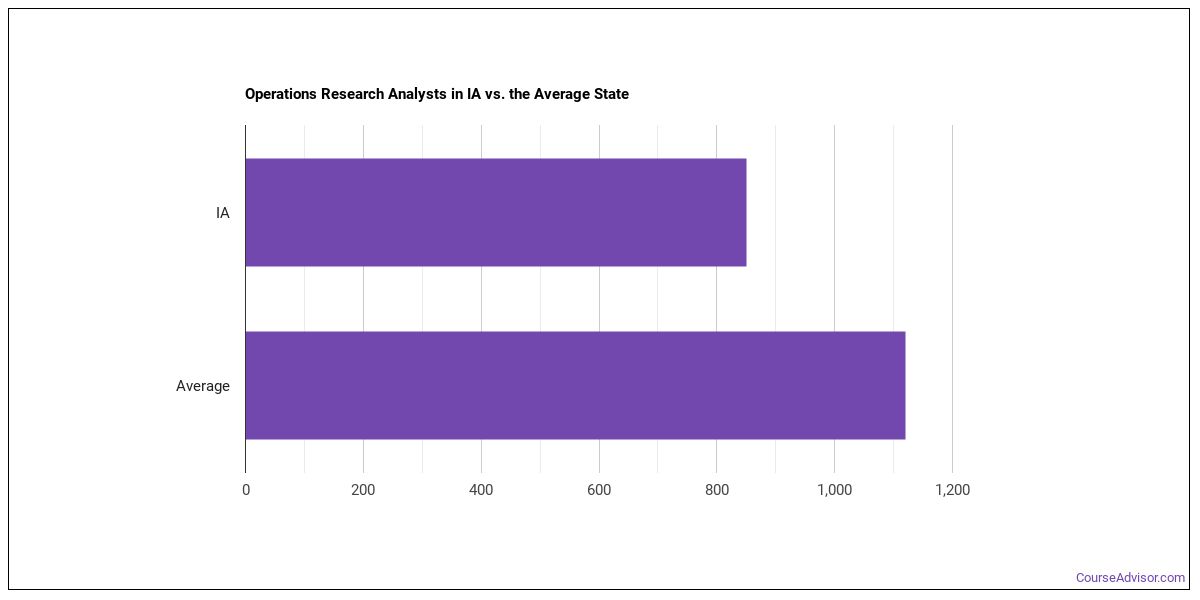
Employment Outlook
Nationally, total employment in this occupation is 276,629 operations research analysts across the United States. In Iowa alone, around 350 people work in this role. That’s fewer than the typical state, which employs around 1,090 operations research analysts.

Top States for Operations Research Analysts Employment
The table below shows the states where the most operations research analysts work.
| State | Number Employed |
|---|---|
| Texas | 12,240 |
| California | 11,030 |
| Florida | 8,230 |
| Virginia | 6,320 |
| New York | 6,020 |
| Illinois | 5,020 |
| Massachusetts | 4,860 |
| Georgia | 4,450 |
| Maryland | 4,280 |
| Wisconsin | 4,080 |
| Pennsylvania | 3,030 |
| Ohio | 2,970 |
| Washington | 2,850 |
| New Jersey | 2,630 |
| Oregon | 2,590 |
| North Carolina | 2,520 |
| District of Columbia | 2,190 |
| Arizona | 2,170 |
| Missouri | 2,010 |
| Indiana | 1,660 |
Highest-Paying States for Operations Research Analysts
The highest-paying states for operations research analysts.
| State | Annual Median Salary |
|---|---|
| Virginia | $123,050 |
| Alabama | $117,540 |
| District of Columbia | $115,980 |
| New York | $109,440 |
| Vermont | $108,800 |
| Ohio | $104,610 |
| Colorado | $104,560 |
| Illinois | $102,750 |
| New Jersey | $101,220 |
| Delaware | $101,210 |
Skills
The most important operations research analysts skills, rated on an importance scale of 0 to 5:
Knowledge Areas
Key knowledge areas for this occupation, rated on an importance scale of 0 to 5:
Abilities
Top abilities for operations research analysts, rated on an importance scale of 0 to 5:
Daily Tasks
Day-to-day, operations research analysts typically:
- Present the results of mathematical modeling and data analysis to management or other end users.
- Define data requirements, and gather and validate information, applying judgment and statistical tests.
- Perform validation and testing of models to ensure adequacy, and reformulate models, as necessary.
- Prepare management reports defining and evaluating problems and recommending solutions.
- Collaborate with others in the organization to ensure successful implementation of chosen problem solutions.
- Formulate mathematical or simulation models of problems, relating constants and variables, restrictions, alternatives, conflicting objectives, and their numerical parameters.
- Observe the current system in operation, and gather and analyze information about each of the component problems, using a variety of sources.
- Analyze information obtained from management to conceptualize and define operational problems.
- Study and analyze information about alternative courses of action to determine which plan will offer the best outcomes.
- Collaborate with senior managers and decision makers to identify and solve a variety of problems and to clarify management objectives.
- Specify manipulative or computational methods to be applied to models.
- Design, conduct, and evaluate experimental operational models in cases where models cannot be developed from existing data.
Work Activities
- Getting Information
- Making Decisions and Solving Problems
- Analyzing Data or Information
- Working with Computers
- Processing Information
- Identifying Objects, Actions, and Events
- Interpreting the Meaning of Information for Others
- Updating and Using Relevant Knowledge
- Thinking Creatively
- Communicating with Supervisors, Peers, or Subordinates
- Developing Objectives and Strategies
- Providing Consultation and Advice to Others
Tools & Technology
Software and systems commonly involved: Hot technologies: Amazon Redshift, Apache Hadoop, Apache Hive, Apple macOS, Bash, C In-demand technologies: Microsoft Excel, Microsoft Office software
What Major Will Prepare You For This Career?
Related college programs include:
- Management Sciences & Methods
- Operations Research
Featured schools near , edit
Related Careers
Careers similar to operations research analysts include:
- Logistics Engineers
- Project Management Specialists
- Management Analysts
- Financial Risk Specialists
- Financial Quantitative Analysts
- Computer Systems Analysts
Also Known As
Advanced Analytics Associate, Analytical Strategist, Analytics Consultant, Business Analyst, Business Operations Analyst, Business Process Analyst, Continuous Improvement Specialist, Decision Analyst, Decision Support Analyst, File System Installer, Forms Analyst, Liaison Planner, Material Liaison, Methods Analyst, Methods Consultant.
References
- U.S. Bureau of Labor Statistics, Occupational Employment and Wage Statistics — https://www.bls.gov/oes/
- O*NET Online — https://www.onetonline.org/
- BLS Employment Projections — https://www.bls.gov/emp/
- O*NET-SOC code: 15-2031.00
Course Advisor provides higher-education, college and university, degree, program, career, salary, and other helpful information to students, faculty, institutions, and other internet audiences. Presented information and data are subject to change. Inclusion on this website does not imply or represent a direct relationship with the company, school, or brand. Information, though believed correct at time of publication, may not be correct, and no warranty is provided. Contact the schools to verify any information before relying on it. Financial aid may be available for those who qualify. The displayed options may include sponsored or recommended results, not necessarily based on your preferences.
© Course Advisor – All Rights Reserved.