Mechanical Engineers in New Hampshire
Thinking about a career as a Mechanical Engineers in New Hampshire? Below are the key facts. Perform engineering duties in planning and designing tools, engines, machines, and other mechanically functioning equipment. Oversee installation, operation, maintenance, and repair of equipment such as centralized heat, gas, water, and steam systems.
What do Mechanical Engineers Make in New Hampshire?
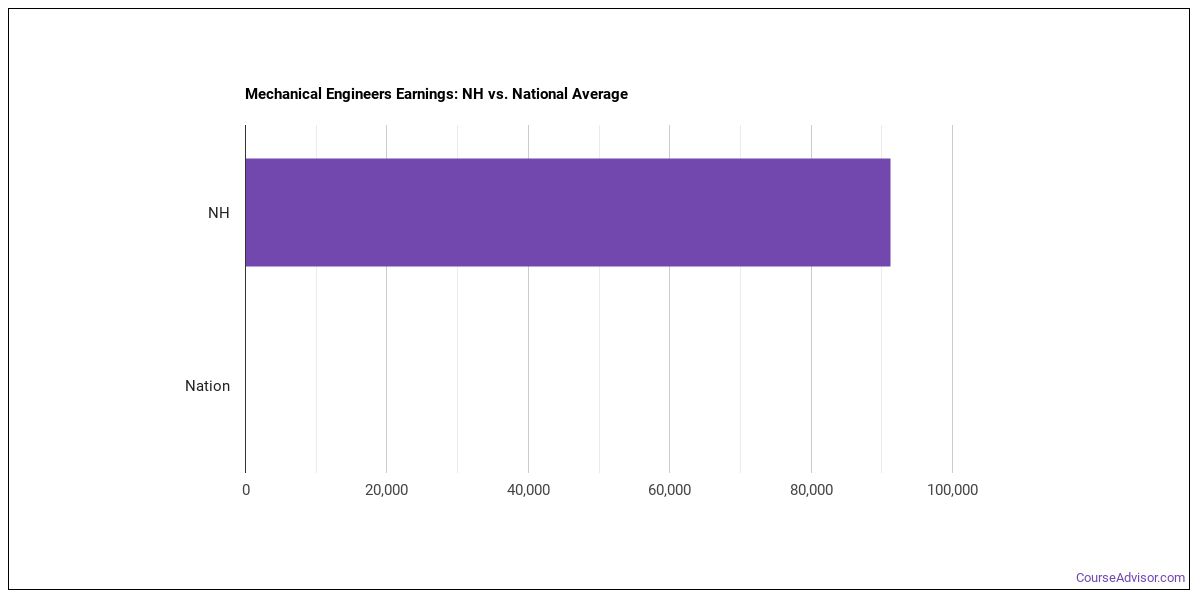
For a mechanical engineers working in New Hampshire, the typical annual salary is $103,890 per year (or roughly $49.95/hour).Earnings range from $72,400 at the 10th percentile to $157,810 at the 90th percentile.
| Wage Statistic | Annual | Hourly |
|---|---|---|
| 10th percentile | $72,400 | $34.81 |
| 25th percentile | $84,990 | $40.86 |
| Median (50th) | $103,890 | $49.95 |
| 75th percentile | $127,810 | $61.45 |
| 90th percentile | $157,810 | $75.87 |

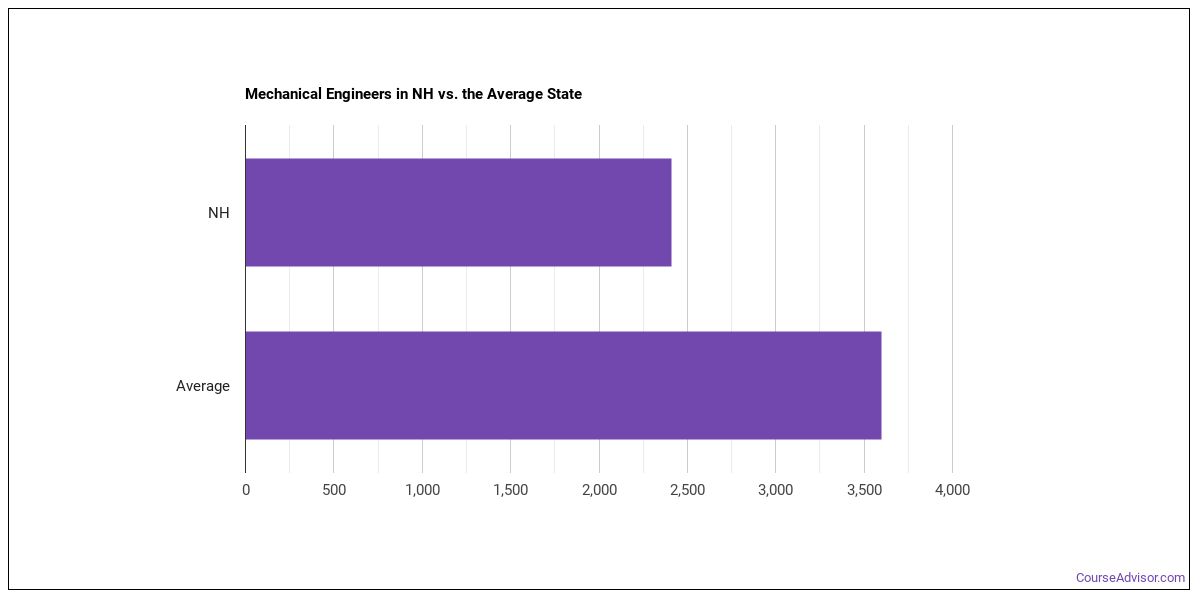
The location quotient — a measure of how concentrated this occupation is in New Hampshire relative to the national average — is 2.03, indicating that mechanical engineers are more concentrated here than the national average.
National Wage Comparison
Nationally, mechanical engineers earn a median of $79,543 per year ($38.24/hour), above the New Hampshire median.
Employment Outlook
National employment for 88,587 mechanical engineers nationwide. In New Hampshire alone, around 2,580 people work in this role. That’s fewer than the typical state, which employs around 3,680 mechanical engineers.

Top New Hampshire Metros for Mechanical Engineers
The largest metro-area employers of mechanical engineers in New Hampshire.
| Metro Area | Number Employed | Annual Median Salary |
|---|---|---|
| Manchester-Nashua, NH | 940 | $105,280 |
Top States for Mechanical Engineers Employment
These states have the highest employment of mechanical engineers work.
| State | Number Employed |
|---|---|
| Michigan | 31,830 |
| California | 27,090 |
| Texas | 18,790 |
| Ohio | 16,420 |
| Pennsylvania | 14,300 |
| Illinois | 9,920 |
| Massachusetts | 9,430 |
| North Carolina | 9,390 |
| Washington | 9,350 |
| Florida | 8,860 |
| Indiana | 8,650 |
| New York | 8,420 |
| Wisconsin | 8,060 |
| Virginia | 7,960 |
| Colorado | 6,850 |
| Maryland | 6,330 |
| Minnesota | 5,970 |
| Alabama | 5,480 |
| Arizona | 5,440 |
| Connecticut | 5,310 |
Highest-Paying States for Mechanical Engineers
The highest-paying states for mechanical engineers.
| State | Annual Median Salary |
|---|---|
| New Mexico | $141,490 |
| District of Columbia | $130,000 |
| Alaska | $129,990 |
| California | $126,370 |
| Massachusetts | $122,670 |
| Wyoming | $116,910 |
| Rhode Island | $115,270 |
| Louisiana | $114,050 |
| Maryland | $111,740 |
| Washington | $109,370 |
Skills
Key mechanical engineers skills, rated on an importance scale of 0 to 5:
Knowledge Areas
Core knowledge areas for this occupation, rated on an importance scale of 0 to 5:
Abilities
The abilities that matter most for mechanical engineers, rated on an importance scale of 0 to 5:
Daily Tasks
Mechanical Engineers typically:
- Read and interpret blueprints, technical drawings, schematics, or computer-generated reports.
- Research, design, evaluate, install, operate, or maintain mechanical products, equipment, systems or processes to meet requirements.
- Specify system components or direct modification of products to ensure conformance with engineering design, performance specifications, or environmental regulations.
- Confer with engineers or other personnel to implement operating procedures, resolve system malfunctions, or provide technical information.
- Investigate equipment failures or difficulties to diagnose faulty operation and recommend remedial actions.
- Recommend design modifications to eliminate machine or system malfunctions.
- Research and analyze customer design proposals, specifications, manuals, or other data to evaluate the feasibility, cost, or maintenance requirements of designs or applications.
- Provide technical customer service.
- Oversee installation, operation, maintenance, or repair to ensure that machines or equipment are installed and functioning according to specifications.
- Assist drafters in developing the structural design of products, using drafting tools or computer-assisted drafting equipment or software.
- Conduct research that tests or analyzes the feasibility, design, operation, or performance of equipment, components, or systems.
- Develop or test models of alternate designs or processing methods to assess feasibility, sustainability, operating condition effects, potential new applications, or necessity of modification.
Work Activities
- Drafting, Laying Out, and Specifying Technical Devices, Parts, and Equipment
- Working with Computers
- Making Decisions and Solving Problems
- Thinking Creatively
- Evaluating Information to Determine Compliance with Standards
- Getting Information
- Updating and Using Relevant Knowledge
- Identifying Objects, Actions, and Events
- Communicating with Supervisors, Peers, or Subordinates
- Organizing, Planning, and Prioritizing Work
- Monitoring Processes, Materials, or Surroundings
- Documenting/Recording Information
Tools & Technology
Technologies frequently used: Hot technologies: Adobe Illustrator, Autodesk AutoCAD, Autodesk AutoCAD Civil 3D, Autodesk Revit In-demand technologies: Autodesk AutoCAD, Autodesk Revit
What Major Will Prepare You For This Career?
Related college programs include:
- Mechanical Engineering
- Engineering Mechanics
- Electromechanical Engineering
Featured schools near , edit
Related Careers
Other careers like mechanical engineers include:
- Electrical Engineers
- Electronics Engineers, Except Computer
- Industrial Engineers
- Manufacturing Engineers
- Fuel Cell Engineers
- Automotive Engineers
Also Known As
Air Conditioning Engineer (AC Engineer), Application Engineer, Automation Engineer, Body Engineer, Brake Engineer, Car Designer, Combustion Engineer, Cooling and Heating Systems Design Engineer, Cryogenics Engineer, Design Engineer, Diesel Engineer, Diesel Retrofit Designer, Distribution Engineer, Dust Control Engineer, Electromechanical Engineer.
References
- U.S. Bureau of Labor Statistics, Occupational Employment and Wage Statistics — https://www.bls.gov/oes/
- O*NET Online — https://www.onetonline.org/
- BLS Employment Projections — https://www.bls.gov/emp/
- O*NET-SOC code: 17-2141.00
Course Advisor provides higher-education, college and university, degree, program, career, salary, and other helpful information to students, faculty, institutions, and other internet audiences. Presented information and data are subject to change. Inclusion on this website does not imply or represent a direct relationship with the company, school, or brand. Information, though believed correct at time of publication, may not be correct, and no warranty is provided. Contact the schools to verify any information before relying on it. Financial aid may be available for those who qualify. The displayed options may include sponsored or recommended results, not necessarily based on your preferences.
© Course Advisor – All Rights Reserved.