Food Processing Workers, All Other: Career Overview
All food processing workers not listed separately.
Featured schools near , edit
The Daily Work of Food Processing Workers, All Other Do?
Related Job Titles
This career also goes by job titles like:
- Olive Pitter
- Pasta Press Operator
- Poultry Hanger
- Yeast Maker
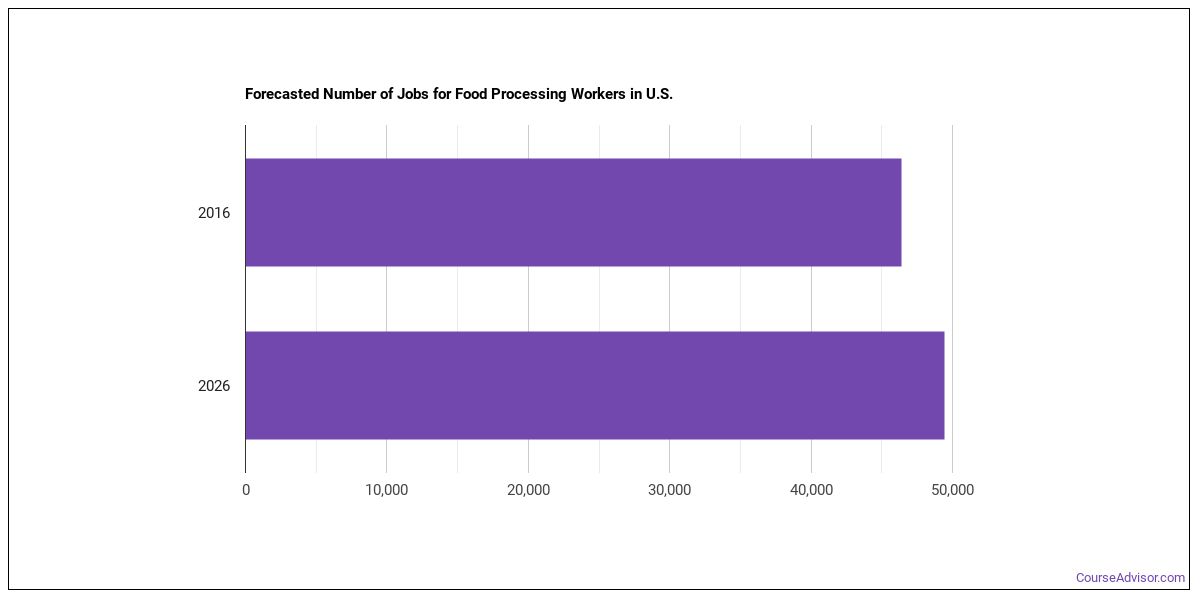
How Many Food Processing Workers, All Other Are There?
The U.S. employs around 844,613 food processing workers, all other working in the United States today. Demand is forecast to grow by +14.8% over the projection horizon.
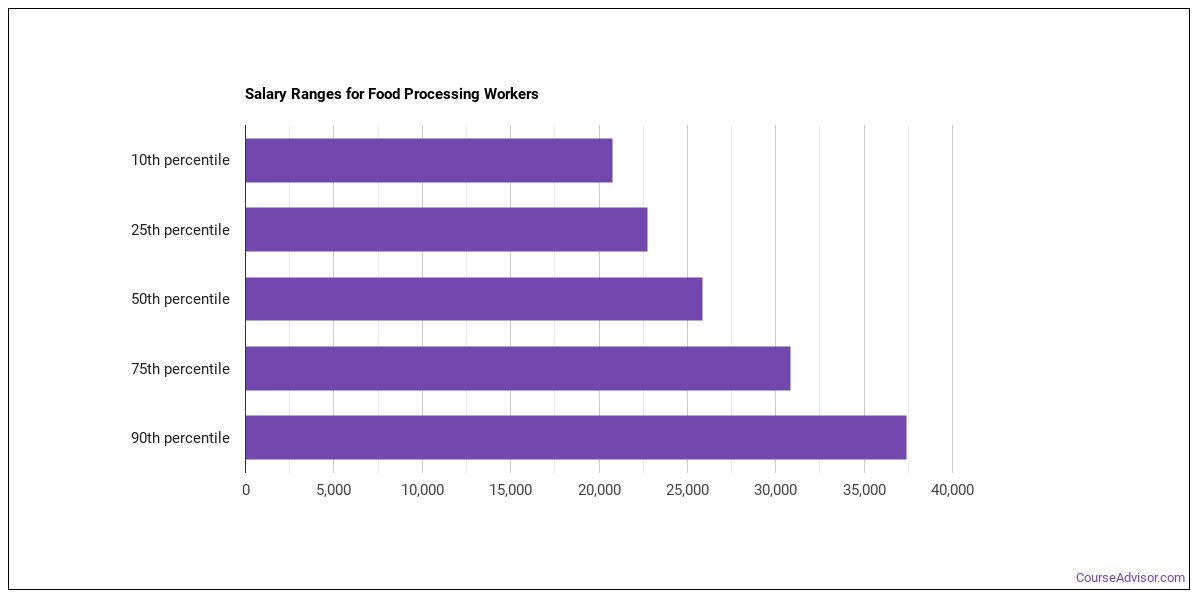
How Much Do Food Processing Workers, All Other Make?
| Statistic | Value |
|---|---|
| Annual median | $60,770 |
| Hourly median | $29.22 |
| 10th percentile | $40,653 |
| 25th percentile | $50,711 |
| 75th percentile | $70,828 |
| 90th percentile | $80,887 |
Wages vary widely based on experience, location, and industry.
Pay by State
| State | Annual median salary |
|---|---|
| Kansas | $45,070 |
| Nebraska | $44,980 |
| Massachusetts | $43,720 |
| Idaho | $43,720 |
| North Dakota | $43,720 |
| Wisconsin | $43,380 |
| Washington | $42,630 |
| Wyoming | $42,570 |
| New Hampshire | $42,300 |
| Tennessee | $42,030 |
| Utah | $41,280 |
| Montana | $41,200 |
| New York | $40,880 |
| Kentucky | $40,710 |
| Iowa | $40,570 |
| Illinois | $40,310 |
| Connecticut | $40,220 |
| Arizona | $40,210 |
| Minnesota | $39,940 |
| Vermont | $39,240 |
| Pennsylvania | $39,210 |
| Texas | $39,110 |
| Mississippi | $38,940 |
| Missouri | $38,890 |
| Indiana | $38,730 |
| Colorado | $38,710 |
| Delaware | $38,580 |
| New Mexico | $38,350 |
| California | $38,300 |
| Michigan | $37,900 |
| Ohio | $37,800 |
| Florida | $37,650 |
| South Carolina | $37,390 |
| Oklahoma | $37,260 |
| Oregon | $37,000 |
| Maryland | $36,950 |
| Alabama | $36,860 |
| Virginia | $36,810 |
| West Virginia | $36,600 |
| New Jersey | $36,420 |
| Georgia | $36,170 |
| North Carolina | $36,080 |
| Arkansas | $36,070 |
| Maine | $34,430 |
| Louisiana | $30,290 |
| Nevada | $29,750 |
| Rhode Island | $29,120 |
Pay by U.S. Region
Pay for food processing workers, all other vary by region. The following regions pay the most:
| Region | Median annual wage | Share of U.S. jobs | Location quotient |
|---|---|---|---|
| Plains States | $41,671 | 14.1% | 3.23 |
| Rocky Mountains | $40,663 | 3.4% | 0.96 |
| Great Lakes | $39,377 | 10.1% | 0.85 |
| Southwest | $39,115 | 12.0% | 1.07 |
| New England | $38,134 | 1.6% | 1.08 |
| Far Western US | $37,935 | 18.1% | 1.13 |
| Middle Atlantic | $37,920 | 8.3% | 1.26 |
| Southeast | $36,125 | 32.4% | 2.42 |
Where the Jobs Cluster
| Metro area | State | Median annual wage | Employment |
|---|---|---|---|
| Rochester, MN | MN | $51,960 | 110 |
| Hanford-Corcoran, CA | CA | $51,910 | 290 |
| Dubuque, IA | IA | $51,750 | 40 |
| Chattanooga, TN-GA | TN | $50,130 | 640 |
| Madison, WI | WI | $48,890 | 50 |
| Nashville-Davidson–Murfreesboro–Franklin, TN | TN | $47,090 | 270 |
| Boston-Cambridge-Newton, MA-NH | MA | $46,950 | 120 |
| Seattle-Tacoma-Bellevue, WA | WA | $46,290 | 160 |
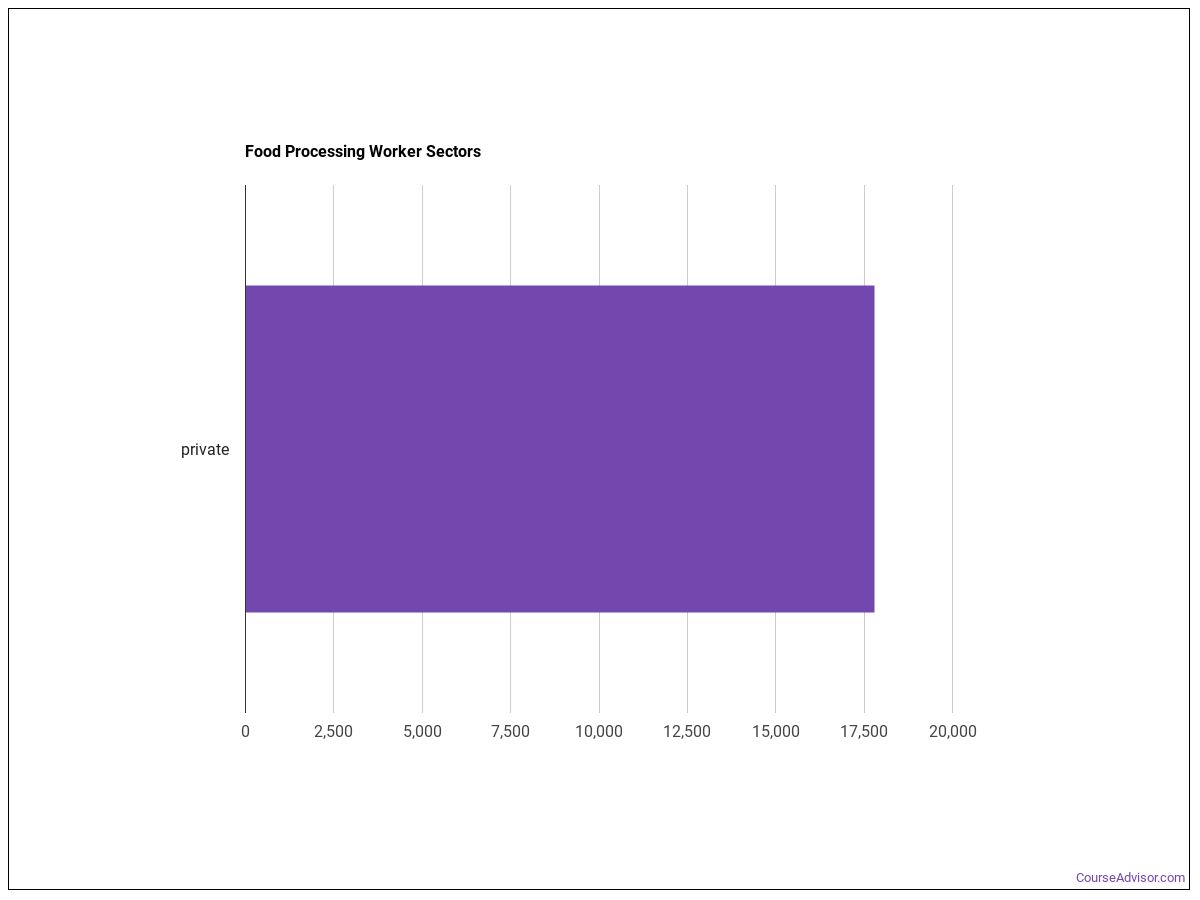
Top Industries Employing Food Processing Workers, All Other
Most food processing workers, all other are concentrated in the following sectors:
| Industry | Employment | Median annual wage |
|---|---|---|
| Manufacturing | 40,370 | $39,020 |
| Retail Trade | 11,760 | $38,350 |
| Wholesale Trade | 2,100 | $35,500 |
| Administrative and Support and Waste Management and Remediation Services | 1,980 | $35,260 |
| Agriculture, Forestry, Fishing and Hunting | 460 | $35,330 |
| Transportation and Warehousing | 90 | $44,170 |
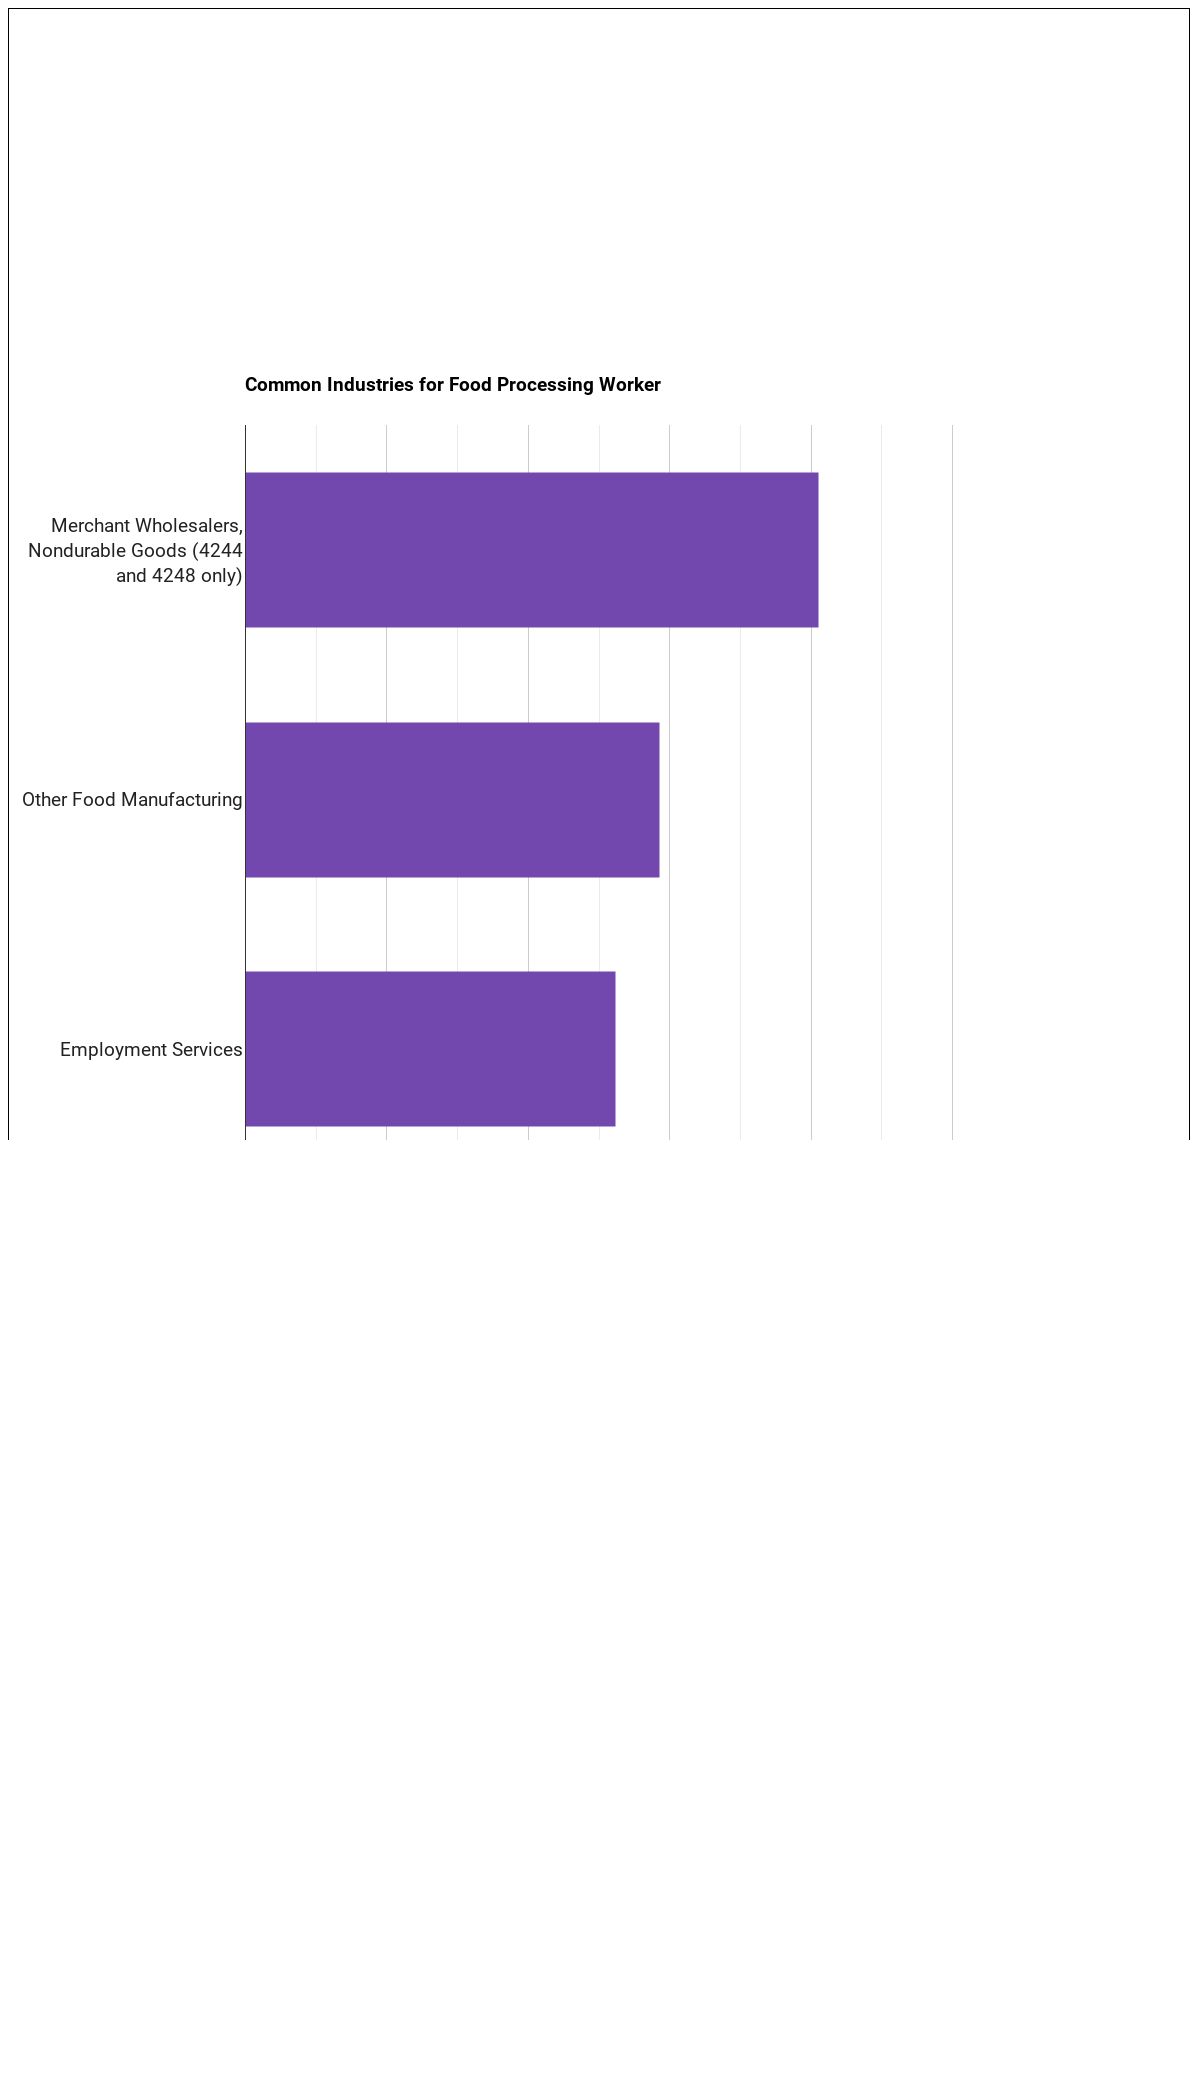
Below are examples of industries where food processing workers, all other work:
About the Data
Statistics shown above are sourced from the following authoritative sources:
- U.S. Bureau of Labor Statistics — Occupational Employment and Wage Statistics (OEWS) for employment and wage data by state and industry.
- BLS Employment Projections for total employment and growth forecasts.
- O*NET (Occupational Information Network) for skills, knowledge, tasks, work activities, work context, technology, and education-zone data.
SOC code: 51-3099.00 (Food Processing Workers, All Other).
Course Advisor provides higher-education, college and university, degree, program, career, salary, and other helpful information to students, faculty, institutions, and other internet audiences. Presented information and data are subject to change. Inclusion on this website does not imply or represent a direct relationship with the company, school, or brand. Information, though believed correct at time of publication, may not be correct, and no warranty is provided. Contact the schools to verify any information before relying on it. Financial aid may be available for those who qualify. The displayed options may include sponsored or recommended results, not necessarily based on your preferences.
© Course Advisor – All Rights Reserved.