Entertainment Attendants and Related Workers, All Other: Career Overview
All entertainment attendants and related workers not listed separately.
Featured schools near , edit
What Tasks Do Entertainment Attendants and Related Workers, All Other Do?
Types of Entertainment Attendants and Related Workers, All Other Jobs
People in this occupation may also be known by titles such as:
- Cardroom Attendant
- Cardroom Plastic Card Grader
- Chip Mucker
- Chip Person
- Floor Attendant
- Gambler
- Game Attendant
- Game Room Attendant
How Many Entertainment Attendants and Related Workers, All Other Are There?
There are roughly 148,093 entertainment attendants and related workers, all other working in the United States today. Employment is projected to grow by +14.0% over the projection horizon.

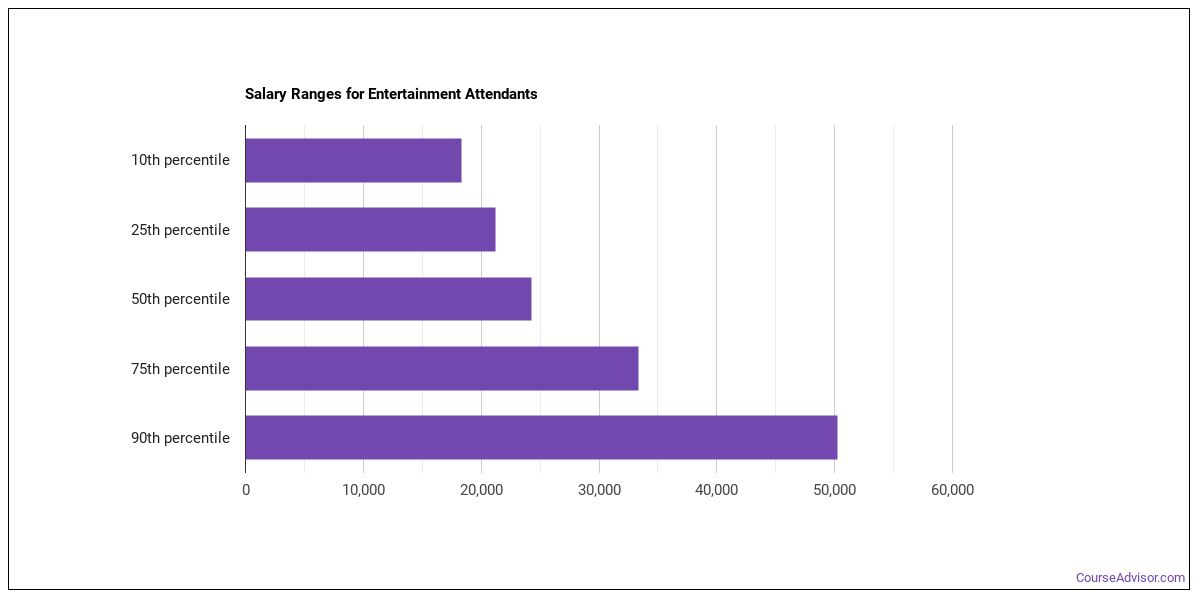
How Much Do Entertainment Attendants and Related Workers, All Other Make?
| Statistic | Value |
|---|---|
| Annual median | $26,952 |
| Hourly median | $12.96 |
| 10th percentile | $20,000 |
| 25th percentile | $23,263 |
| 75th percentile | $30,641 |
| 90th percentile | $34,330 |
Compensation varies based on experience, location, and industry.
Entertainment Attendants and Related Workers, All Other Salary by State
| State | Annual median salary |
|---|---|
| New York | $59,860 |
| Nevada | $46,380 |
| Missouri | $43,830 |
| Colorado | $41,210 |
| Hawaii | $41,090 |
| Michigan | $38,280 |
| Ohio | $38,210 |
| California | $37,810 |
| North Carolina | $37,720 |
| Connecticut | $36,850 |
| Idaho | $35,610 |
| Texas | $33,520 |
| Pennsylvania | $33,200 |
| Louisiana | $32,520 |
| New Jersey | $32,450 |
| Oregon | $32,050 |
| Maryland | $31,200 |
| Florida | $31,160 |
| Tennessee | $29,460 |
| Montana | $29,260 |
| Utah | $28,490 |
| Minnesota | $28,180 |
| Georgia | $23,820 |
Pay by U.S. Region
Compensation for entertainment attendants and related workers, all other shift depending on where you work. Top regions by median wage:
| Region | Median annual wage | Share of U.S. jobs | Location quotient |
|---|---|---|---|
| Far Western US | $40,227 | 29.4% | 3.34 |
| Great Lakes | $38,228 | 3.9% | 0.57 |
| New England | $36,850 | 0.4% | 0.35 |
| Plains States | $36,195 | 6.1% | 1.38 |
| Southwest | $33,520 | 12.4% | 1.15 |
| Rocky Mountains | $32,452 | 4.5% | 2.02 |
| Middle Atlantic | $31,200 | 1.5% | 0.72 |
| Southeast | $28,170 | 41.7% | 4.41 |
Top Metro Areas
| Metro area | State | Median annual wage | Employment |
|---|---|---|---|
| New York-Newark-Jersey City, NY-NJ | NY | $50,790 | |
| Las Vegas-Henderson-North Las Vegas, NV | NV | $46,380 | 560 |
| San Jose-Sunnyvale-Santa Clara, CA | CA | $44,080 | 100 |
| Los Angeles-Long Beach-Anaheim, CA | CA | $37,890 | 390 |
| Sacramento-Roseville-Folsom, CA | CA | $37,300 | 40 |
| San Diego-Chula Vista-Carlsbad, CA | CA | $36,510 | 400 |
| Salt Lake City-Murray, UT | UT | $36,500 | 50 |
| San Antonio-New Braunfels, TX | TX | $33,520 | 140 |
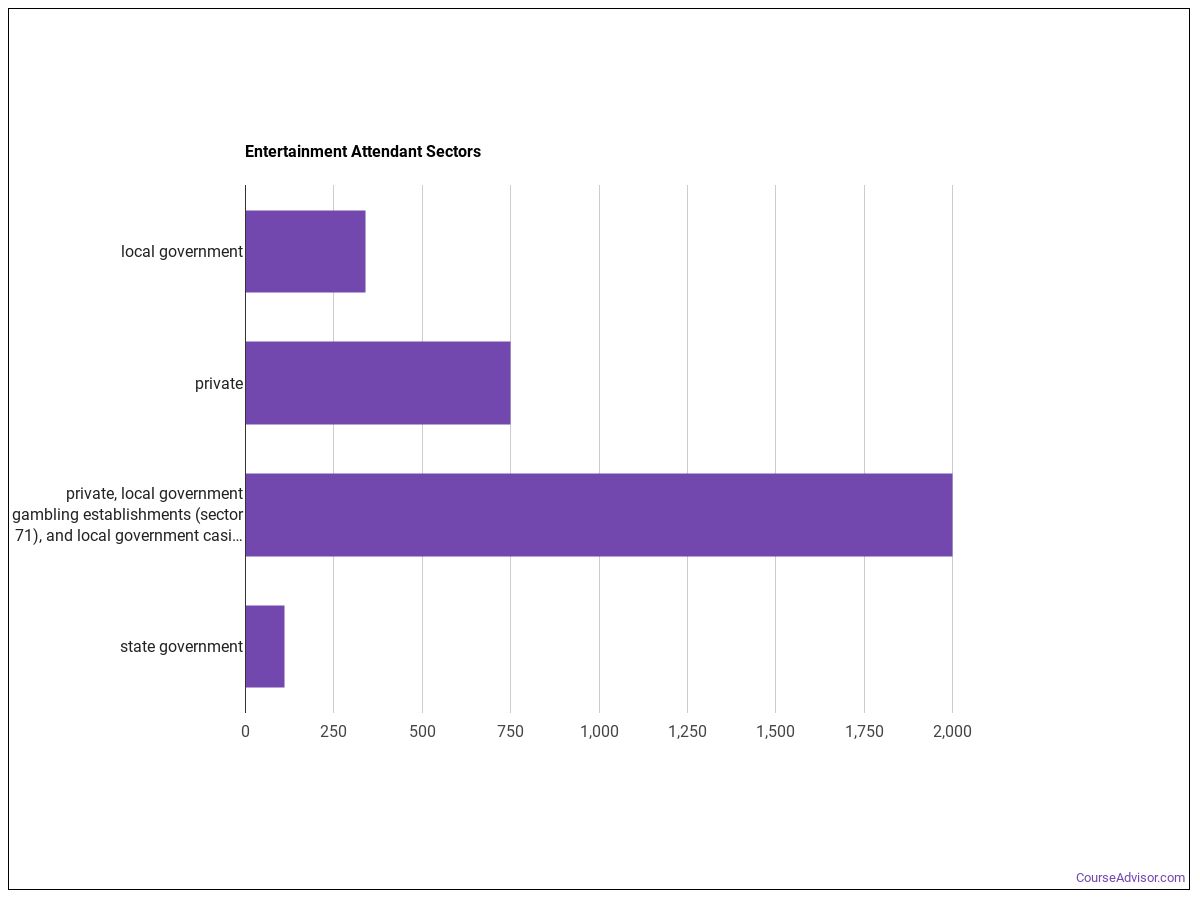
Industry Breakdown
Most entertainment attendants and related workers, all other are concentrated in the following sectors:
| Industry | Employment | Median annual wage |
|---|---|---|
| Arts, Entertainment, and Recreation | 3,590 | $32,810 |
| Information | 1,120 | $23,910 |
| Accommodation and Food Services | 820 | $37,410 |
| Educational Services | 770 | $37,200 |
| Other Services (except Public Administration) | 280 | $29,790 |
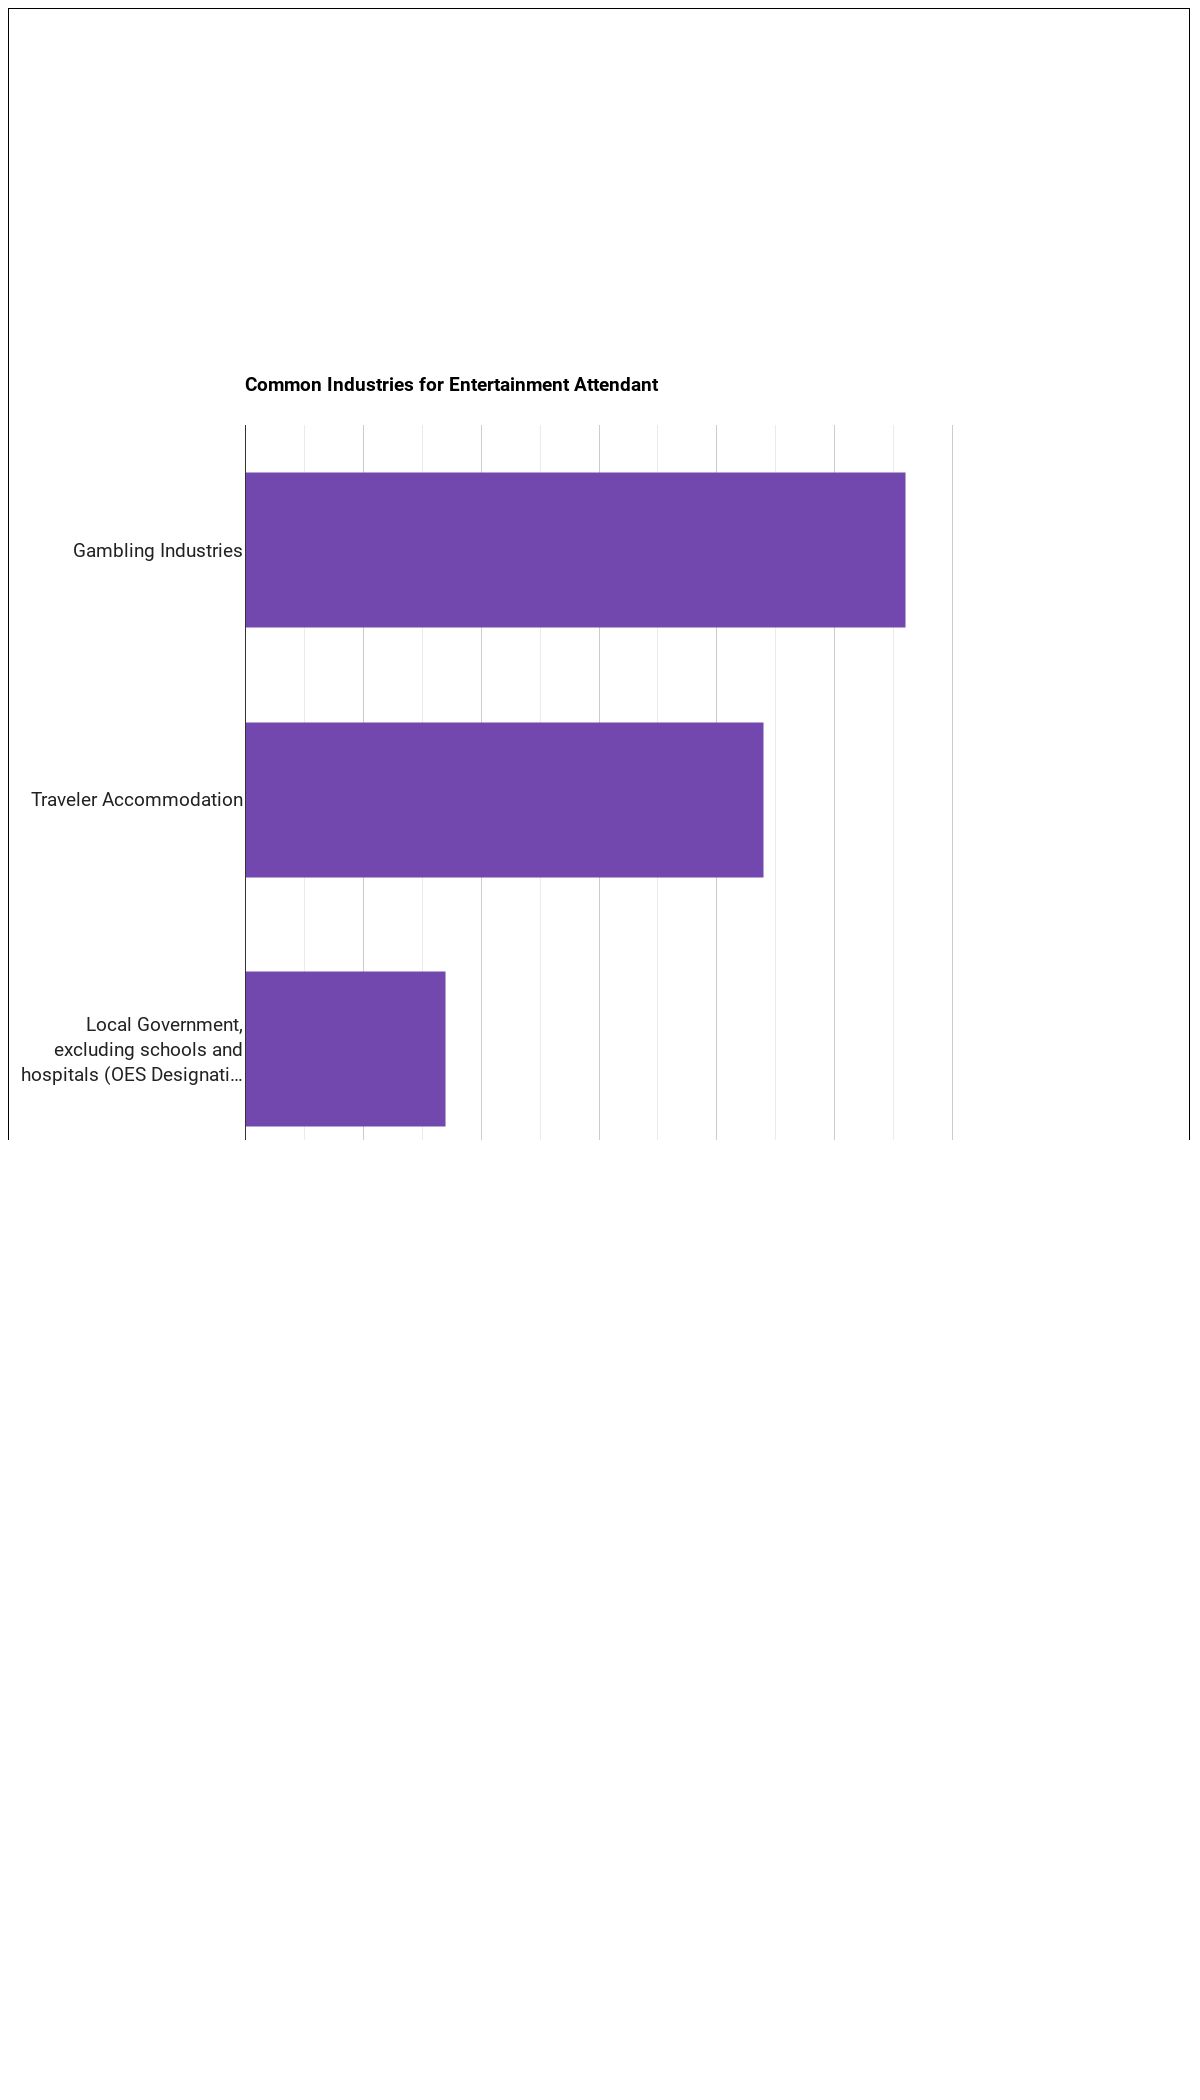
The table below shows some of the most common industries where those employed in this career field work.
Sources
Statistics shown above are sourced from the following authoritative sources:
- U.S. Bureau of Labor Statistics — Occupational Employment and Wage Statistics (OEWS) for employment and wage data by state and industry.
- BLS Employment Projections for total employment and growth forecasts.
- O*NET (Occupational Information Network) for skills, knowledge, tasks, work activities, work context, technology, and education-zone data.
SOC code: 39-3099.00 (Entertainment Attendants and Related Workers, All Other).
Course Advisor provides higher-education, college and university, degree, program, career, salary, and other helpful information to students, faculty, institutions, and other internet audiences. Presented information and data are subject to change. Inclusion on this website does not imply or represent a direct relationship with the company, school, or brand. Information, though believed correct at time of publication, may not be correct, and no warranty is provided. Contact the schools to verify any information before relying on it. Financial aid may be available for those who qualify. The displayed options may include sponsored or recommended results, not necessarily based on your preferences.
© Course Advisor – All Rights Reserved.