Choreographers in Oregon
Want to work in Oregon as a Choreographer? Read this first!
- Projected employment for Choreographers in Oregon is growing faster than average.
Featured schools near , edit
How Many Choreographers Work in Oregon?
There were 70 Choreographers employed in this state in 2017.
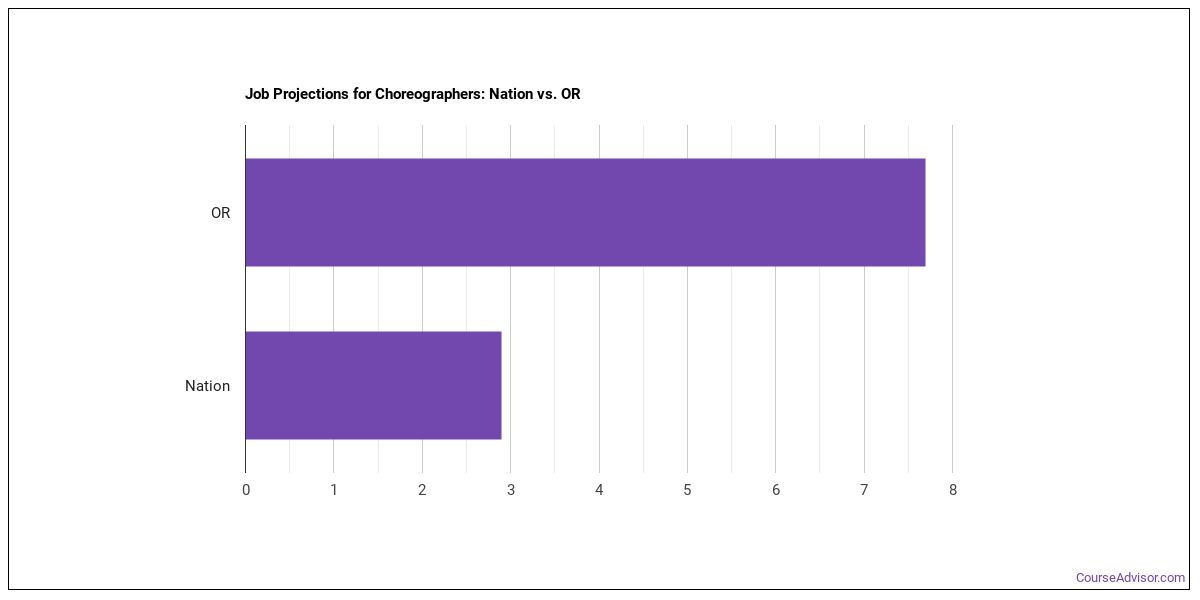
Job Projections for Oregon
Jobs for Choreographers in this state are growing at a rate of 7.7% which is faster than the nationwide estimated projection of 2.9%.
Oregon Annual Job Openings
The BLS estimates 20 annual job openings, and a total of 140 jobs for Oregon Choreographers in 2026.
Nationwide, the prediction is 900 annual jobs and 7,100 total jobs in 2026.
What do Choreographers Make in Oregon?
Workers in this field were paid a median of $24.29 an hour in 2017.
Top States for Choreographers Employment
View the list below to see where most Choreographers work.
| State | Number Employed | Annual Median Salary |
|---|---|---|
| Texas | 860 | $55,620 |
| Virginia | 430 | $60,120 |
| California | 410 | $60,020 |
| Minnesota | 400 | $38,470 |
| Louisiana | 270 | $36,860 |
| Connecticut | 270 | $56,110 |
| South Dakota | 190 | $31,610 |
| Florida | 160 | $54,770 |
| Kansas | 150 | $37,690 |
| Pennsylvania | 150 | $33,210 |
| Wyoming | 120 | $32,370 |
| District of Columbia | 110 | $0 |
| Ohio | 80 | $47,100 |
| Illinois | 80 | $26,630 |
| Nevada | 70 | $55,820 |
| New York | 60 | $84,800 |
| Tennessee | 50 | $66,070 |
| New Jersey | 40 | $47,050 |
| Massachusetts | 30 | $66,010 |
Below are the states where Choreographers get paid the most:
| State | Annual Median Salary |
|---|---|
| New York | $84,800 |
| Tennessee | $66,070 |
| Massachusetts | $66,010 |
| Oklahoma | $63,770 |
| Virginia | $60,120 |
| California | $60,020 |
| Maryland | $56,990 |
| Connecticut | $56,110 |
| Nevada | $55,820 |
| Texas | $55,620 |
Related Careers in OR
Discover similar careers:
References
- Bureau of Labor Statistics (BLS)
- College Factual
- National Center for Education Statistics
- O*NET Online
- Image Credit: By Jazzart Dance Theatre under License
More about our data sources and methodologies.
Featured Schools
 Request Info
|
Southern New Hampshire University You have goals. Southern New Hampshire University can help you get there. Whether you need a bachelor's degree to get into a career or want a master's degree to move up in your current career, SNHU has an online program for you. Find your degree from over 200 online programs. Learn More > |
Course Advisor provides higher-education, college and university, degree, program, career, salary, and other helpful information to students, faculty, institutions, and other internet audiences. Presented information and data are subject to change. Inclusion on this website does not imply or represent a direct relationship with the company, school, or brand. Information, though believed correct at time of publication, may not be correct, and no warranty is provided. Contact the schools to verify any information before relying on it. Financial aid may be available for those who qualify. The displayed options may include sponsored or recommended results, not necessarily based on your preferences.
© Course Advisor – All Rights Reserved.