Choreographers in Illinois
Get the information you need to know about working as a Choreographer.
- Choreographers in Illinois earn lower salaries than the typical U.S. wage earner.
Featured schools near , edit
How Many Choreographers Work in Illinois?
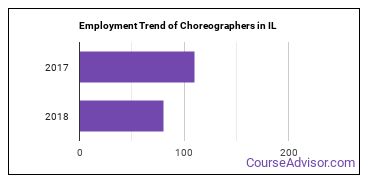
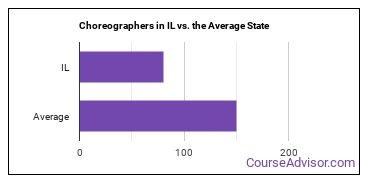
80 people worked as Choreographers in 2018 in this state.
There were 110 Choreographers employed in this state in 2017.
That’s a decline of 30 jobs between 2017 and 2018.

The typical state has 150 Choreographers working in it, which means Illinois has fewer Choreographers than average.

What do Choreographers Make in Illinois?
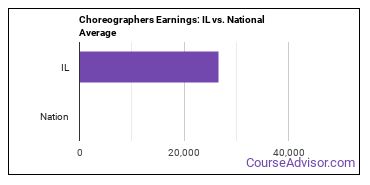
In 2018 wages for Choreographers ranged from $18,440 to $62,840 with $26,630 being the median annual salary.
Broken down to an hourly rate, workers in this field made anywhere from $8.87 to $30.21. The median hourly rate was $12.8.
Workers in this field were paid a median of $16.91 an hour in 2017.
The hourly rate declined by $4.11.
The median salary in Illinois is higher than the nationwide median salary.

Top Illinois Metros for Choreographers
The table below shows some of the metros in this state with the most Choreographers.
| Metro | Number Employed | Annual Median Salary |
|---|---|---|
| Chicago-Naperville-Elgin, IL-IN-WI | 40 | $45,250 |
Top States for Choreographers Employment
View the list below to see where most Choreographers work.
| State | Number Employed | Annual Median Salary |
|---|---|---|
| Texas | 860 | $55,620 |
| Virginia | 430 | $60,120 |
| California | 410 | $60,020 |
| Minnesota | 400 | $38,470 |
| Louisiana | 270 | $36,860 |
| Connecticut | 270 | $56,110 |
| South Dakota | 190 | $31,610 |
| Florida | 160 | $54,770 |
| Kansas | 150 | $37,690 |
| Pennsylvania | 150 | $33,210 |
| Wyoming | 120 | $32,370 |
| District of Columbia | 110 | $0 |
| Ohio | 80 | $47,100 |
| Illinois | 80 | $26,630 |
| Nevada | 70 | $55,820 |
| New York | 60 | $84,800 |
| Tennessee | 50 | $66,070 |
| New Jersey | 40 | $47,050 |
| Massachusetts | 30 | $66,010 |
Below are the states where Choreographers get paid the most:
| State | Annual Median Salary |
|---|---|
| New York | $84,800 |
| Tennessee | $66,070 |
| Massachusetts | $66,010 |
| Oklahoma | $63,770 |
| Virginia | $60,120 |
| California | $60,020 |
| Maryland | $56,990 |
| Connecticut | $56,110 |
| Nevada | $55,820 |
| Texas | $55,620 |
Related Careers in IL
Discover similar careers:
References
- Bureau of Labor Statistics (BLS)
- College Factual
- National Center for Education Statistics
- O*NET Online
- Image Credit: By Jazzart Dance Theatre under License
More about our data sources and methodologies.
Featured Schools
 Request Info
|
Southern New Hampshire University You have goals. Southern New Hampshire University can help you get there. Whether you need a bachelor's degree to get into a career or want a master's degree to move up in your current career, SNHU has an online program for you. Find your degree from over 200 online programs. Learn More > |
