Bartenders in Connecticut
Thinking about a career as a Bartenders in Connecticut? Below are the key facts. Mix and serve drinks to patrons, directly or through waitstaff.
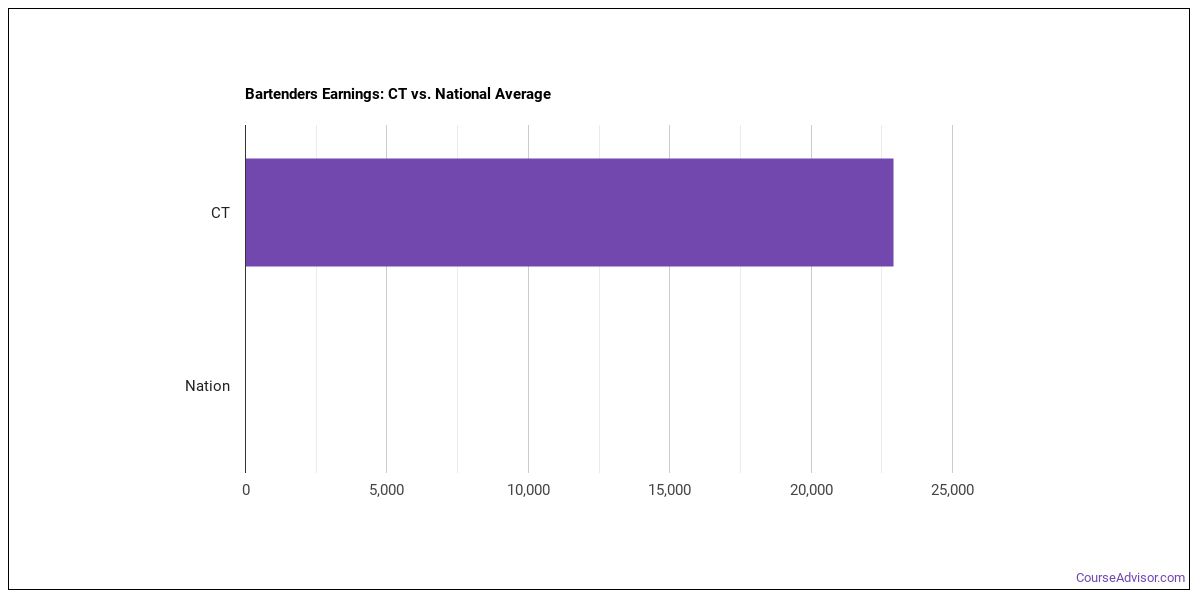
What do Bartenders Make in Connecticut?
For bartenders working in Connecticut, the typical annual salary is $34,420 per year (or about $16.55/hour).Pay can range from $32,640 at the 10th percentile to $81,520 at the 90th percentile.
| Wage Statistic | Annual | Hourly |
|---|---|---|
| 10th percentile | $32,640 | $15.69 |
| 25th percentile | $32,640 | $15.69 |
| Median (50th) | $34,420 | $16.55 |
| 75th percentile | $60,810 | $29.24 |
| 90th percentile | $81,520 | $39.19 |

Location quotient — how concentrated this career is in Connecticut nationwide is 1.02.
National Wage Comparison
Nationally, bartenders earn a median of $28,151 per year ($13.53/hour), above the Connecticut median.
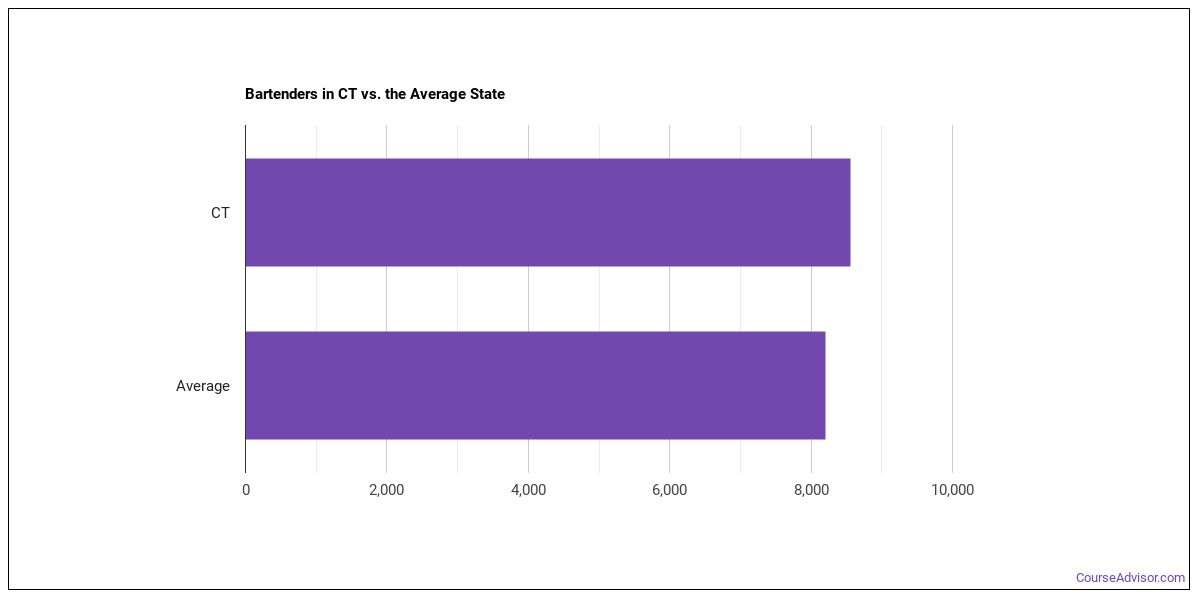
Employment Outlook
Nationally, total employment in this occupation is 523,148 bartenders in the U.S.. In Connecticut alone, about 8,280 people work in this role. That’s below the typical state, which employs around 8,740 bartenders.

Top Connecticut Metros for Bartenders
These are the Connecticut metros with the most bartenders in Connecticut.
| Metro Area | Number Employed | Annual Median Salary |
|---|---|---|
| Hartford-West Hartford-East Hartford, CT | 2,940 | $34,070 |
| Bridgeport-Stamford-Danbury, CT | 1,940 | $35,160 |
| New Haven, CT | 1,340 | $33,520 |
| Norwich-New London-Willimantic, CT | 990 | $34,230 |
| Waterbury-Shelton, CT | 670 | $33,740 |
Top States for Bartenders Employment
View the states that employ the most bartenders work.
| State | Number Employed |
|---|---|
| California | 69,790 |
| Texas | 57,990 |
| Florida | 54,800 |
| New York | 42,550 |
| Illinois | 40,520 |
| Pennsylvania | 34,740 |
| Wisconsin | 29,340 |
| Ohio | 27,530 |
| Minnesota | 21,570 |
| Massachusetts | 21,080 |
| Michigan | 19,530 |
| North Carolina | 19,500 |
| Washington | 19,140 |
| Colorado | 17,670 |
| New Jersey | 17,500 |
| Nevada | 17,090 |
| Virginia | 15,870 |
| Georgia | 14,980 |
| Missouri | 14,530 |
| Maryland | 13,770 |
Highest-Paying States for Bartenders
These states pay the most for bartenders.
| State | Annual Median Salary |
|---|---|
| Hawaii | $68,820 |
| New York | $60,750 |
| District of Columbia | $54,930 |
| Vermont | $54,310 |
| Washington | $48,320 |
| Maine | $47,630 |
| Virginia | $46,860 |
| New Jersey | $45,660 |
| Virgin Islands | $42,630 |
| Arizona | $40,860 |
Skills
The most important bartenders skills, rated on an importance scale of 0 to 5:
Knowledge Areas
Core knowledge areas for this occupation, rated on an importance scale of 0 to 5:
Abilities
Key abilities for bartenders, rated on an importance scale of 0 to 5:
Daily Tasks
Common tasks include:
- Clean glasses, utensils, and bar equipment.
- Collect money for drinks served.
- Balance cash receipts.
- Check identification of customers to verify age requirements for purchase of alcohol.
- Clean bars, work areas, and tables.
- Attempt to limit problems and liability related to customers' excessive drinking by taking steps such as persuading customers to stop drinking, or ordering taxis or other transportation for intoxicated patrons.
- Take beverage orders from serving staff or directly from patrons.
- Serve wine, and bottled or draft beer.
- Plan, organize, and control the operations of a cocktail lounge or bar.
- Stock bar with beer, wine, liquor, and related supplies such as ice, glassware, napkins, or straws.
- Serve snacks or food items to customers seated at the bar.
- Mix ingredients, such as liquor, soda, water, sugar, and bitters, to prepare cocktails and other drinks.
Work Activities
- Performing for or Working Directly with the Public
- Establishing and Maintaining Interpersonal Relationships
- Estimating the Quantifiable Characteristics of Products, Events, or Information
- Getting Information
- Training and Teaching Others
- Handling and Moving Objects
- Inspecting Equipment, Structures, or Materials
- Judging the Qualities of Objects, Services, or People
- Monitoring and Controlling Resources
- Communicating with Supervisors, Peers, or Subordinates
- Coordinating the Work and Activities of Others
- Guiding, Directing, and Motivating Subordinates
Tools & Technology
Common tools and software used in this occupation include: Hot technologies: Facebook
What Major Will Prepare You For This Career?
Several college majors map to this occupation:
- Culinary Arts
Featured schools near , edit
Related Careers
Other careers like bartenders include:
- Food Service Managers
- Chefs and Head Cooks
- First-Line Supervisors of Food Preparation and Serving Workers
- Cooks, Fast Food
- Cooks, Institution and Cafeteria
- Cooks, Private Household
Also Known As
Banquet Bartender, Bar Attendant, Bar Captain, Bar Tender, Barkeep, Barkeeper, Barmaid, Barman, Bartender, Catering Bartender, Drink Mixer, Event Bartender, Mixologist, Restaurant Bartender, Service Bartender.
References
- U.S. Bureau of Labor Statistics, Occupational Employment and Wage Statistics — https://www.bls.gov/oes/
- O*NET Online — https://www.onetonline.org/
- BLS Employment Projections — https://www.bls.gov/emp/
- O*NET-SOC code: 35-3011.00
Course Advisor provides higher-education, college and university, degree, program, career, salary, and other helpful information to students, faculty, institutions, and other internet audiences. Presented information and data are subject to change. Inclusion on this website does not imply or represent a direct relationship with the company, school, or brand. Information, though believed correct at time of publication, may not be correct, and no warranty is provided. Contact the schools to verify any information before relying on it. Financial aid may be available for those who qualify. The displayed options may include sponsored or recommended results, not necessarily based on your preferences.
© Course Advisor – All Rights Reserved.